
- Title
-
Protocol to measure spontaneous locomotion, graded exercise oxygen consumption, and cross-sectional area of skeletal muscle cells in zebrafish
- Authors
- Castro-Sepulveda, M., Tabasso, C., Grepper, D., Martinotti, A., Aguettaz, A.K.F., Lagarrigue, S., Amati, F.
- Source
- Full text @ STAR Protoc
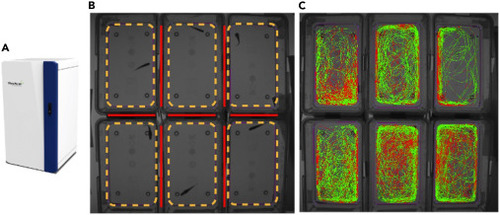
Measurement of spontaneous locomotion using the ZebraCube and ZebraLab tracking video system (A) The ZebraCube. (B) Zebrafish tanks inside the ZebraCube. Red lines indicate cardboard dividers between tanks; tanks are outlined by orange dashed lines. (C) Final visual output from the ZebraLab software displaying velocity thresholds: Slow velocity is ≥2 cm/s (green line); Fast velocity is ≥7 cm/s (red line). Pausing is counted as movement <2 cm/s (black line). |
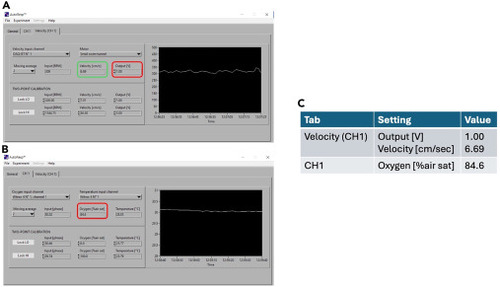
Loligo AutoResp software panel (A and B) Software panels displaying the parameters that need confirmation before starting experiments. (C) Table presenting experimental parameters. |
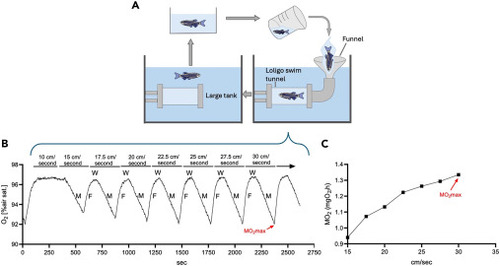
Zebrafish installation and Loligo swim tunnel O2 saturation (A) Schematic of zebrafish transfer to Loligo swim tunnel. (B) Kinetics of O2 saturation during the incremental exercise test of one 12-month-old WT male zebrafish from Grepper, Tabasso et al.1 F indicates operational flush pump and increasing oxygen saturation; W signifies waiting period where the pump stops to stabilize oxygen concentration; M is the measurement phase where oxygen concentration is being recorded. (C) Plot of MO2 by velocity for the same fish. |
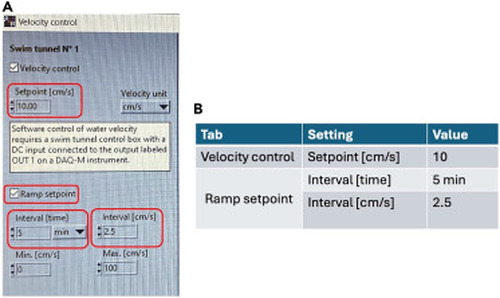
Loligo AutoResp software panel to set up the graded exercise test (A) Software panel showing the parameters to set before starting a graded exercise test: velocity and interval duration. (B) Table representing proposed parameters for a general population of zebrafish. |
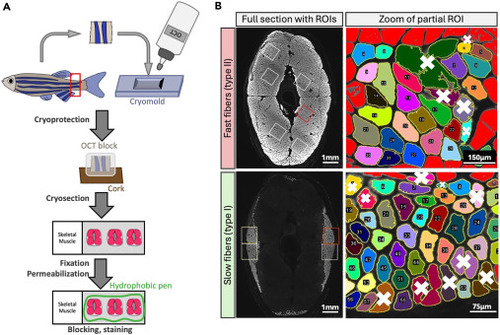
Outline of the protocol to evaluate skeletal muscle fiber size in slow and fast fibers (A) Schematic representation of skeletal muscle dissection, cryoprotection and cryosection. The red square represents where the muscle sample is systematically selected. (B) Representative image of fast and slow fibers ROI positioning. The right panels show the zoom of the red ROI for each fiber type with the outline of selected fibers post thresholding. Automatically selected fibers are shown in colors, non-selected fibers and thresholding is shown in red. White crosses show examples of fibers that were manually excluded. |