
|
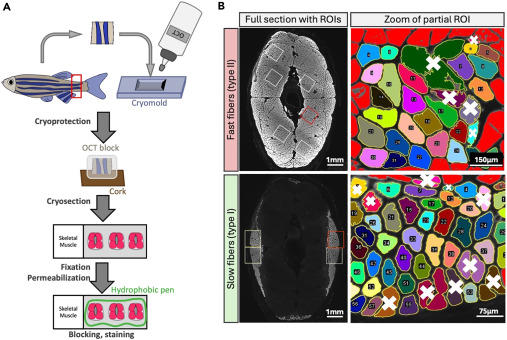
Fig. 5 Outline of the protocol to evaluate skeletal muscle fiber size in slow and fast fibers (A) Schematic representation of skeletal muscle dissection, cryoprotection and cryosection. The red square represents where the muscle sample is systematically selected. (B) Representative image of fast and slow fibers ROI positioning. The right panels show the zoom of the red ROI for each fiber type with the outline of selected fibers post thresholding. Automatically selected fibers are shown in colors, non-selected fibers and thresholding is shown in red. White crosses show examples of fibers that were manually excluded.