
FIGURE
Fig. 1
- ID
- ZDB-FIG-250717-45
- Publication
- Castro-Sepulveda et al., 2025 - Protocol to measure spontaneous locomotion, graded exercise oxygen consumption, and cross-sectional area of skeletal muscle cells in zebrafish
- Other Figures
- All Figure Page
- Back to All Figure Page
Fig. 1
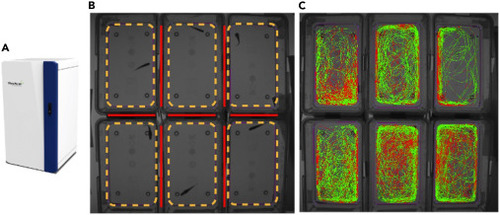
Measurement of spontaneous locomotion using the ZebraCube and ZebraLab tracking video system (A) The ZebraCube. (B) Zebrafish tanks inside the ZebraCube. Red lines indicate cardboard dividers between tanks; tanks are outlined by orange dashed lines. (C) Final visual output from the ZebraLab software displaying velocity thresholds: Slow velocity is ≥2 cm/s (green line); Fast velocity is ≥7 cm/s (red line). Pausing is counted as movement <2 cm/s (black line). |
Expression Data
Expression Detail
Antibody Labeling
Phenotype Data
Phenotype Detail
Acknowledgments
This image is the copyrighted work of the attributed author or publisher, and
ZFIN has permission only to display this image to its users.
Additional permissions should be obtained from the applicable author or publisher of the image.
Full text @ STAR Protoc