
- Title
-
Therapeutic Potential of Methylindoline Derivative in Ameliorating Cadmium-Induced Nephritis Experimented in Zebrafish Model
- Authors
- Nayak, S.P.R.R., Herold, A., Shiny, M., Vedula, G.S., Soundharrajan, I., Almutairi, B.O., Namasivayam, S.K.R., Kumaradoss, K.M., Arockiaraj, J.
- Source
- Full text @ J. Biochem. Mol. Toxicol.
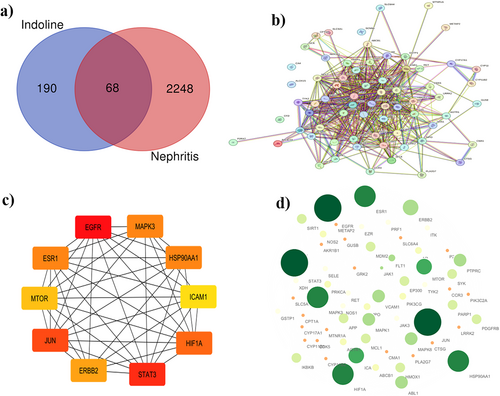
Network pharmacological analysis of Indoline derivatives. (a) Venn diagram of drug-disease targets (b) STRING database PPI network (c) Structures depict the top 10 core hub targets (d) Core targets of Nephritis targeted by indoline derivatives based on degree centrality (DC), betweenness centrality (BC), and closeness centrality (CC) differentiated by their sizes. |
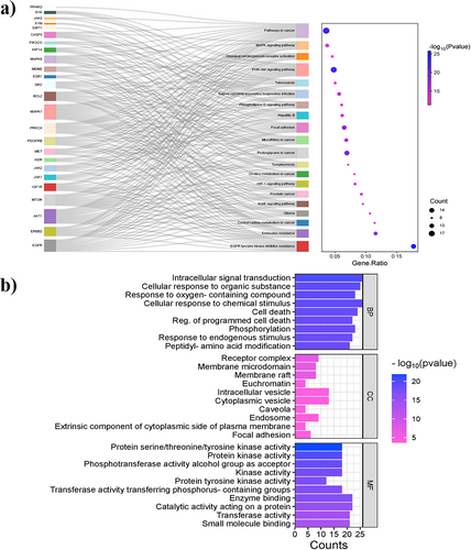
KEGG and GO enrichment analysis of Indoline derivatives. (a) KEGG Enrichment analysis (b) GO enrichment analysis. |
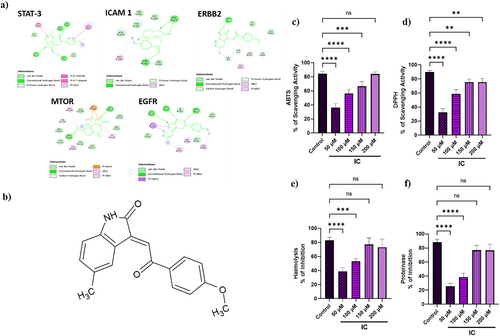
In Silico and In Vitro anti-inflammatory activity of IC. (a) Molecular docking simulation results of the best target-ligand interactions in 2D (b) Molecular structure of (E)-3-(2-(4-methoxyphenyl)-2-oxoethylidene)-5-methylindolin-2-one (IC) (c) ABTS assay (d) DPPH assay (e) Hemolytic assay (f) Proteinase inhibition assay. Triplicate experiments were conducted, and the results are represented as mean ± SD. The asterix (*) denotes the significance level compared to the control group. *p < 0.0332, **p < 0.0021, ***p < 0.0002, and ****p < 0.0001. |
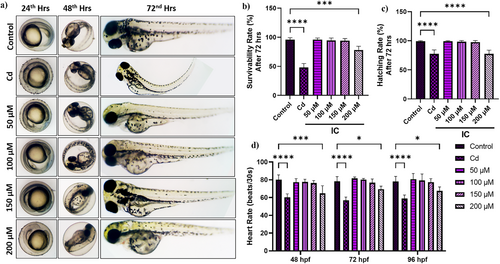
Developmental toxicity of IC. (a) Representative photomicrograph of zebrafish embryos observed to determine the toxicity effect of IC between 24 and 72 h (b) Survivability rate (c) Hatching rate (d) Heart rate. Triplicate experiments were conducted, and the results are represented as mean ± SD. The asterix (*) denotes the significance level compared to the control group. *p < 0.0332, **p < 0.0021, ***p < 0.0002, and ****p < 0.0001. |

Measurement of intracellular ROS (Cd denotes Cadmium; RIPM denotes Rapamycin). (a) Fluorescent image of intracellular ROS (b) Quantitative measurement of intracellular ROS production. Triplicate experiments were conducted, and the results are represented as mean ± SD. The asterix (*) denotes the significance level compared to the control group. *p < 0.0332, **p < 0.0021, ***p < 0.0002, and ****p < 0.0001. |
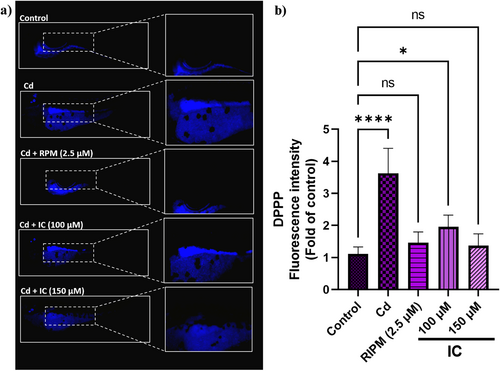
Measurement of intracellular lipid peroxidation. (Cd denotes Cadmium; RIPM denotes Rapamycin). (a) Fluorescent image of intracellular Lipid peroxidation (b) Quantitative measurement of intracellular Lipid peroxidation. Triplicate experiments were conducted, and the results are represented as mean ± SD. The asterix (*) denotes the significance level compared to the control group. *p < 0.0332, **p < 0.0021, ***p < 0.0002, and ****p < 0.0001. |
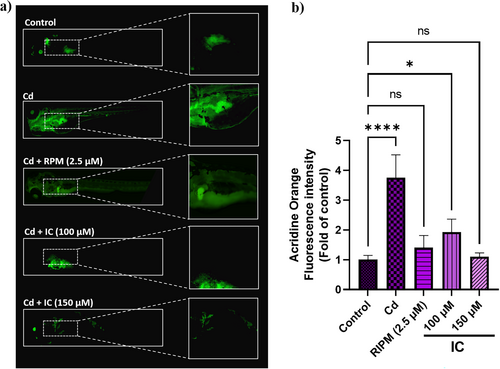
Measurement of intracellular Apoptosis. (Cd denotes Cadmium; RIPM denotes Rapamycin). (a) Fluorescent image of intracellular apoptosis (b) Quantitative measurement of intracellular apoptosis. Triplicate experiments were conducted, and the results are represented as mean ± SD. The asterix (*) denotes the significance level compared to the control group. *p < 0.0332, **p < 0.0021, ***p < 0.0002, and ****p < 0.0001. |
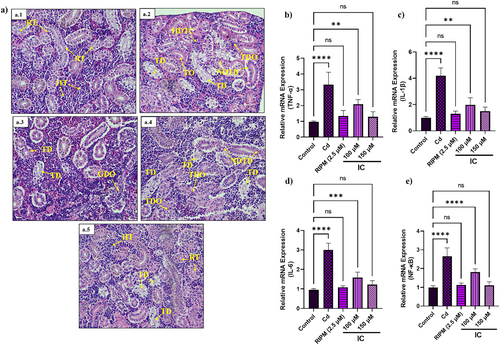
Effect of IC treatment on pro-inflammatory gene expression and Cd-treated renal tissue morphology. (Cd denotes Cadmium; RIPM denotes Rapamycin; TD denotes tubular degeneration; TDO denotes tubular disorganization; GDO denotes glomerular disorganization; HDTC denotes hyaline degeneration of tubular cells; NDTC denotes nuclear degeneration of tubular cells) (a) H&E staining of adult zebrafish intestine (a.1) Control (a.2) Cd (a.3) RIPM (2.5 Μm) (a.4) Cd+IC (100 µM) (a.5) Cd+IC (150 µM) (b) Gene expression levels of TNF-α (c) IL-1β (d) IL-6 (e) NF-κB. Triplicate experiments were conducted, and the results are represented as mean ± SD. The asterix (*) denotes the significance level compared to the control group. *p < 0.0332, **p < 0.0021, ***p < 0.0002, and ****p < 0.0001. |