
Image
|
Figure Caption
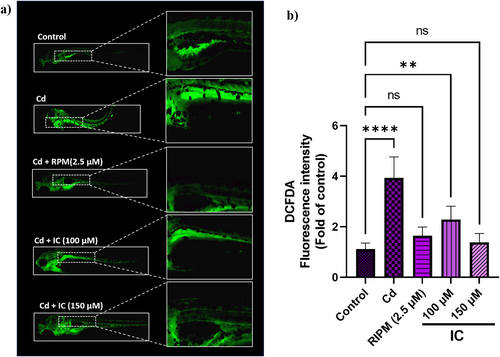
Fig. 5 Measurement of intracellular ROS (Cd denotes Cadmium; RIPM denotes Rapamycin). (a) Fluorescent image of intracellular ROS (b) Quantitative measurement of intracellular ROS production. Triplicate experiments were conducted, and the results are represented as mean ± SD. The asterix (*) denotes the significance level compared to the control group. *p < 0.0332, **p < 0.0021, ***p < 0.0002, and ****p < 0.0001.
Acknowledgments
This image is the copyrighted work of the attributed author or publisher, and
ZFIN has permission only to display this image to its users.
Additional permissions should be obtained from the applicable author or publisher of the image.
Full text @ J. Biochem. Mol. Toxicol.