
- Title
-
Thallium-induced neurocardiotoxicity in zebrafish: Protective role of adaptive UPR and DNA repair
- Authors
- Chang, Y., Wu, C.H., Chen, J.H., Inoue, T., Chiang, C.K.
- Source
- Full text @ Ecotoxicol. Environ. Saf.
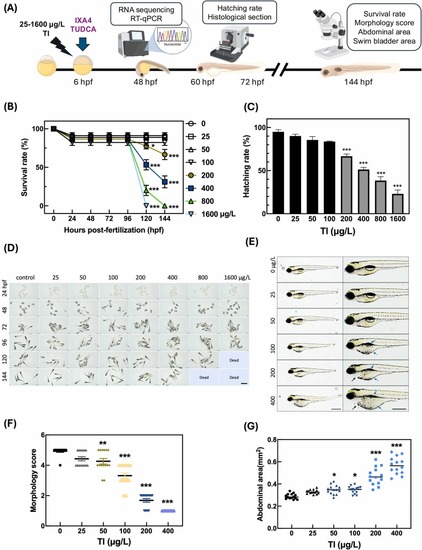
Tl exposure affects zebrafish embryo survival, hatching rate, and morphology.(A) Zebrafish embryos were exposed to various concentrations of Tl (0–1600 μg/L), starting at 6 hpf (hours post-fertilization). Survival rate, hatching rate, morphology, abdominal area, and swim bladder area were observed at multiple time points (48–144 hpf). Transcriptomic analysis was performed at 48 hpf. (B) Survival rates of zebrafish embryos exposed to different Tl concentrations (0–1600 μg/L) over 144 hpf. (C) Hatching rates of zebrafish embryos were assayed at 60 hpf after exposure to Tl (0–1600 μg/L). (D) Representative images of zebrafish embryos and larvae exposed to Tl at different time points (24, 48, 72, 96, 120, and 144 hpf). (E) Representative images of zebrafish larvae at 144 hpf after exposure to Tl (0–400 μg/L). Morphological abnormalities included swim bladder deflation (blue arrows), yolk retention (blue dashed-line arrows), and pericardial edema (black arrows). (F) Morphology scores and (G) abdominal area measurements of the zebrafish larvae. Data are shown as scatter plots representing individual measurements, with horizontal lines indicating the mean of each group (n = 10–15 larvae per group). Statistical significance was determined by one-way ANOVA with post-hoc analysis. *p < 0.05, * *p < 0.01, * **p < 0.001 compared to the control group. Scale bar, 500 µm. |
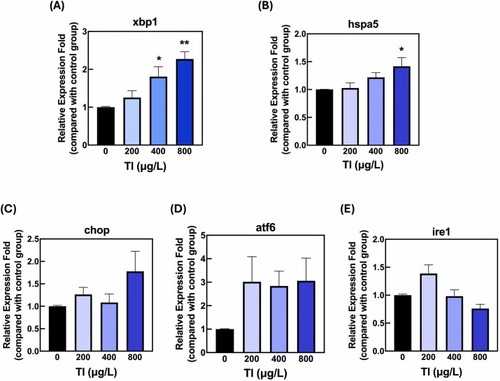
Effects of Tl exposure on ER stress-related gene expression in zebrafish embryos.Relative expression levels of ER stress-related genes (A) X-box binding protein 1 (xbp1), (B) Heat shock protein family A member 5 (hspa5), (C) C/EBP homologous protein (chop), (D) Activating transcription factor 6 (atf6), and (E) Inositol-requiring enzyme 1 (ire1) in zebrafish embryos exposed to different Tl concentrations (0, 200, 400, 800 μg/L) from 6 to 48 hpf. Data are presented as average fold changes relative to the control group, with n = 3 for each group. Statistical significance was determined using a one-way ANOVA followed by a post-hoc analysis. *p < 0.05, * *p < 0.01, compared to the control group. |

Effects of IXA4 and TUDCA on survival, hatching rate, and morphology in zebrafish embryos and larvae exposed to Tl.(A) Survival rates of zebrafish embryos exposed to Tl (200 μg/L) with or without IXA4 (20 μM) or TUDCA (20 μM) treatments to 144 hpf. Data are presented as mean ± SD (n = 10–15 embryos per group). (B) Hatching rates of zebrafish embryos at 60 hpf under different treatment conditions, including control, IXA4 (20 μM), TUDCA (20 μM), Tl (200 μg/L), Tl + IXA4, and Tl + TUDCA. Data are expressed as mean ± SD (n = 10–15 embryos per group). (C) Representative images of zebrafish larvae at 144 hpf under control conditions or exposed to Tl (200 μg/L) with or without IXA4 (20 μM) or TUDCA (20 μM) treatments, showing morphological changes across treatment groups. (D) Representative images of zebrafish larvae at 144 hpf exposed to Tl (200 μg/L) with or without IXA4 (20 μM) or TUDCA (20 μM). Morphological abnormalities included swim bladder deflation (blue arrows), yolk retention (blue dashed-line arrows), and pericardial edema (black arrows). (E) Morphology scores of zebrafish larvae at 144 hpf exposed to Tl with or without IXA4 or TUDCA. Data are presented as individual data points for each group, with horizontal lines indicating the mean values. (F) Swim bladder area (mm²) and (G) abdominal area (mm²) measurements of zebrafish larvae at 144 hpf. Data are presented as individual data points for each group. Statistical significance was determined using t-tests. * *p < 0.01, * **p < 0.001, compared to the indicated group. n = 10–15 embryos per group. Scale bar, 500 µm. |
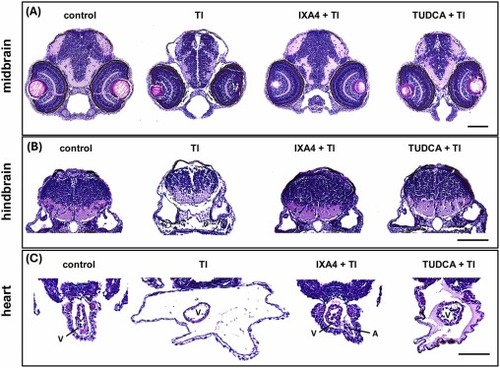
Effects of Tl exposure on the histology of zebrafish embryos.The representative figures of H&E-stained sections of zebrafish (A) midbrain, (B) hindbrain, and (C) heart transverse after treated with Tl (800 μg/L), Tl + IXA4 (20 μM), and Tl + TUDCA (20 μM) from 6 to 72 hpf. Arrows indicate atrium (A) or ventricle (V) of zebrafish. n = 6 embryos per group show similar results. Scale bar, 100 µm. |

Effects of Tl exposure combined with IXA4 or TUDCA treatment on the transcriptome of zebrafish embryos.(A) Heatmap showing the expression patterns of differentially expressed genes (DEGs) among the control, Tl, Tl+IXA4, and Tl+TUDCA treatment groups, represented as Z-scores. (B) Bar graph illustrating the number of DEGs compared to the control group, including upregulated genes (orange) and downregulated genes (blue) for the Tl, Tl+IXA4, and Tl+TUDCA groups. Volcano plots displaying the changes in gene expression: (C) Tl versus control, (D) Tl+IXA4 versus control, and (E) Tl+TUDCA versus control. Red dots represent significant DEGs, with cut off value that absolute log2 fold change ≥ 1 and adjusted p-value < 0.05. Results are based on RNA-seq analysis, with an exposure period from 6 to 48 hpf and a sample size of n = 3 per group. |

Gene set enrichment analysis (GSEA) and qPCR validation reveal Tl-induced transcriptional changes related to neural and cardiovascular development, partially reversed by ER stress modulators. (A) Ridge plot based on RNA-seq analysis shows significantly enriched gene sets between the control and TI groups, with color gradients representing adjusted p-values. Nervous system development-related GO BP pathways include (B) axon development (GO), positive regulation of nervous system development (GO), cell morphogenesis involved in neuron differentiation (GO), and cardiovascular system-related pathways GO BP pathways include blood vessel morphogenesis (GO), heart morphogenesis (GO), and heart development (GO) were enriched in control group compare to TI. Each subplot visualizes the ranked distribution and enrichment score curves, highlighting the distribution of genes within the ranked gene sets. All the gene sets from (B) to (G) have normalized enrichment score (NES) < -1.5, p value < 0.001, and q value < 0.001. (H) natriuretic peptide B (nppb) and (I) jun B proto-oncogene (junb), associated with heart development, and (J) neuritin 1-like b (nrn1lb) and (K) neurotrophin 3 (ntf3), associated with neural development, were analyzed in the control group, Tl (800 μg/L) group, Tl + IXA4 (20 μM) group, and Tl + TUDCA (20 μM) group after exposure from 6 to 48 hpf. Data are presented as average fold changes relative to the control group, with n = 3 per group. Statistical significance was determined using unpaired t-test analysis. *p < 0.05, * *p < 0.01, * **p < 0.001, compared to the indicated group. |
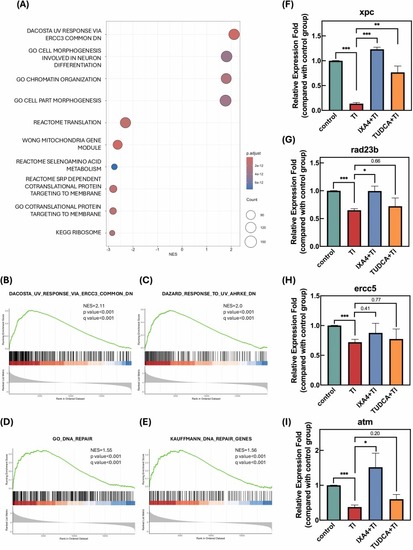
IXA4 enhances DNA repair-related pathway activation and gene expression in zebrafish embryos. GSEA results compare IXA4 +TI vs TI treatment. (A) Dot plot visualizing normalized enrichment scores (NES) for enriched gene sets identified through GSEA. The size of each dot represents the gene count, while the color gradient corresponds to adjusted p-values. GSEA plots for DNA repair-related pathways, including (B) dacosta uv response via ercc3 common dn, (C) dazard response to uv ahrke dn, (D) dna repair (GO), and (E) kauffmann dna repair genes were enriched in IXA4 +TI group. Each plot illustrates the ranked distribution of genes expression fold changes of TI comapre to control, enrichment score curves, and distribution of genes in the gene sets. All the gene sets from (B) to (E) have NES > 1.5, p < 0.001, and q < 0.001, indicating significant enrichment in IXA4 +TI groups compared to TI. Relative expression levels of (F) xeroderma pigmentosum complementation group C (xpc), (G) RAD23 homolog B (rad23b), (H) excision repair cross-complementation group 5 (ercc5) and (I) ataxia telangiectasia mutated (atm) in control, Tl (800 μg/L), Tl + IXA4 (20 μM), and Tl + TUDCA (20 μM) groups from 6 to 48 hpf. Data are presented as average fold changes relative to the control group, with n = 3 for each group. Statistical significance was determined using an unpaired t-test. *p < 0.05, * *p < 0.01, * **p < 0.001 compared to the indicated group. |