
- Title
-
Anti-Müllerian hormone signalling sustains circadian homeostasis in zebrafish
- Authors
- Lin, Q., Du, X., Ren, F., Liu, Y., Gong, G., Ge, S., Li, W., Li, Z., Zhou, L., Duan, M., Li, X.Y., Wang, G.Z., Xiao, R., Gui, J.F., Mei, J.
- Source
- Full text @ Nat. Commun.
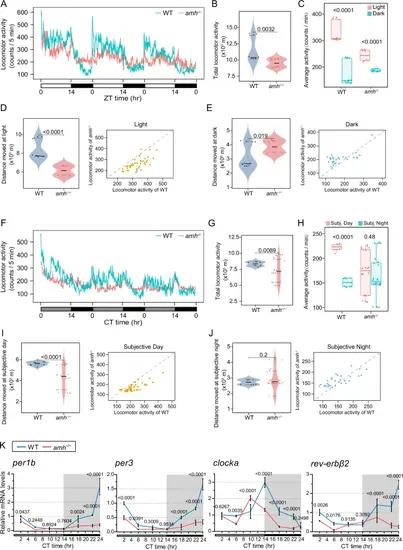
Amh is required for the regulation of the circadian clock.Amh is required for the regulation of the circadian clock.The locomotor activities were monitored and analysed in female WT control and amh−/− mutants under LD (A–E) and DD (F–J) conditions. The total locomotor activities in 72 h (B, G), the quantification of average activities (C, H) and the moving distance and activity during the light-phase (D) dark-phase (E) subjective day (I) or subjective night (J) were shown. In the waveforms of locomotor activities, each point was calculated from the 5 min binned data across 3 days. For violin plots, dots and triangle correspond to individual zebrafish and the black and grey horizontal lines display the median as well as 25th and 75th percentiles. The box-and-whisker plots were presented as interquartile ranges with the median indicated by a line and whiskers extending from the minimum to the maximum values. For B–E n = 12 (WT) and n = 8 (amh−/−), (G–J) n = 8 (WT) and n = 24 (amh−/−). Statistical analysis was performed using two-sided unpaired t-test. K Quantitative real-time PCR analysis of core clock genes in pituitaries harvested at the seven indicated time points under DD condition from WT and amh−/− females. Target gene expression levels are shown relative to the beta-actin 2 reference gene actb2. The expression of WT CT2 was used for normalization. Data are presented as mean values ± SD, n = 3, two-sided unpaired t-test. ZT represents zeitgeber time, where ZT 0 corresponds to lights on; CT represents circadian time. Source data are provided as a Source Data file. |
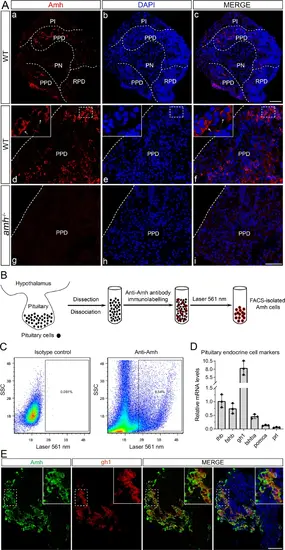
Amh protein distribution and Amh-positive cell identification in the pituitary gland.A Representative images: pituitary sections of adult WT and amh−/− female zebrafish immunolabelled with antiserum against Amh, in triplicate. B Schematic illustration of the isolation of Amh-immunolabelled pituitary cells from adult WT female zebrafish by fluorescence-activated cell sorting (FACS). C Representative scatterplots showing the staining of pituitary cells with anti-Amh and its isotype control. D Relative mRNA expression of endocrine cell marker genes in isolated Amh-positive pituitary cells. The expression of lhb was used for normalization. Data are presented as mean values ± SD and the individual data points are depicted (n = 3). E Representative images: double staining of WT pituitary sections by immunofluorescence staining of Amh (in green) and fluorescence in situ hybridization of gh1 (in red), a marker of somatotropes, in triplicate. PN pars nervosa, PI pars intermedia, PPD proximal pars distalis, RPD rostral pars distalis, DAPI 4’,6-diamidino-2-phenylindole. Scale bars, 50 μm. Source data are provided as a Source Data file. |
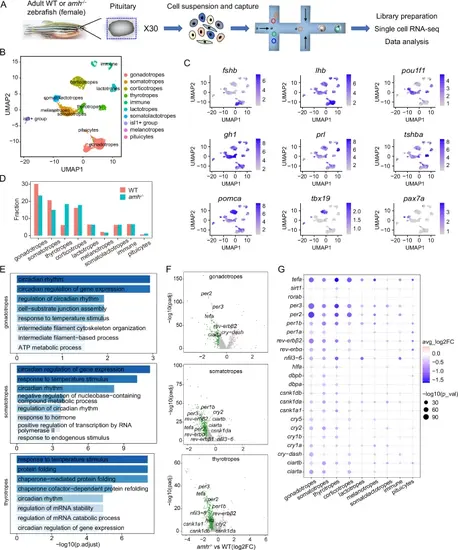
Cell type-specific regulation of the molecular clock by Amh was revealed by single-cell transcriptome analysis of the pituitary.A Schematic overview of the process of cell isolation and single-cell RNA-seq analysis of the zebrafish pituitary using the 10X Genomics platform (30 pituitaries in each group, WT and amh−/−). B UMAP visualization shows the unsupervised clustering of the aggregated results of two scRNA-seq experiments, revealing 10 major clusters of pituitary cells present in zebrafish. Each dot represents one cell, and colours represent cell clusters as indicated. C UMAP visualization of cluster marker genes. UMAP, uniform manifold approximation and projection. D Bar graph showing the percentages of each cell cluster in the pituitaries of WT and amh−/− zebrafish. E Gene ontology enrichment for the downregulated genes from the major affected pituitary cell populations of amh−/− zebrafish. The top 8 terms for biological process (BP) were shown. Hypergeometric test and Benjamini-Hochberg method used for multiple comparisons correction. F Volcano plot showing differential circadian clock gene expression between amh−/− and WT zebrafish in the major affected pituitary cell lineages. G Dot plot showing the expression changes in circadian clock genes across the pituitary cell clusters from WT and amh−/− female zebrafish. For F, G two-sided unpaired Wilcoxon test and adjustments were made for multiple comparisons. Source data are provided as a Source Data file. |
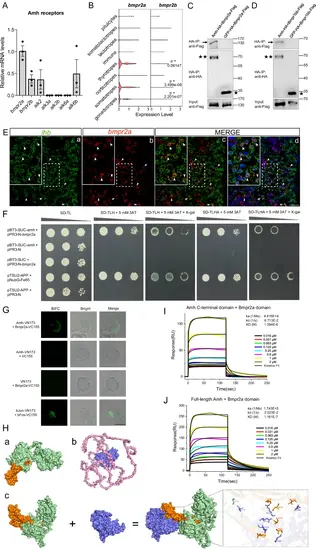
Amh binds to its Bmpr2a/Bmpr1bb receptors in zebrafish.A Relative mRNA expression of candidate receptors of Amh in the isolated Amh-positive pituitary cells determined by quantitative real-time PCR analyses. The expression of bmpr2a was used for normalization. Data are plotted as mean ± SEM, n = 3. B The expression level distributions of candidate type II receptor genes are shown as violin plots across WT pituitary cell clusters. The p-value was calculated using the two-sided unpaired Wilcoxon test. C, D Amh-HA or GFP-HA was cotransfected with Bmpr2a-Flag and Bmpr1bb-Flag into 293T cells. Cell lysates were immunoprecipitated using anti-HA Dynabeads and analysed by Western blotting. E Representative images: double labelling of bmpr2a (red) and lhb (green) in WT pituitary sections by fluorescent in situ hybridization, in triplicate. Scale bars, 25 μm. F The Y2H assays showing the interaction between Amh and Bmpr2a. G Amh interacted with Bmpr2a in BiFC assays, in triplicate. Scale bars, 10 μm. H The 3D structures of Amh (a) and Bmpr2a (b), (c) the molecular docking analysis between Amh and Bmpr2a. I-J The SPR analysis for binding kinetics between Bmpr2a domain and Amh C-terminal domain (I) or the full-length Amh (J). SPR response profile for Bmpr2a at different concentrations with sensor-immobilized Amh C-terminal domain or the full-length Amh. ka, association rate constant; kd, dissociation rate constant; KD, dissociation constant. Source data are provided as a Source Data file. |
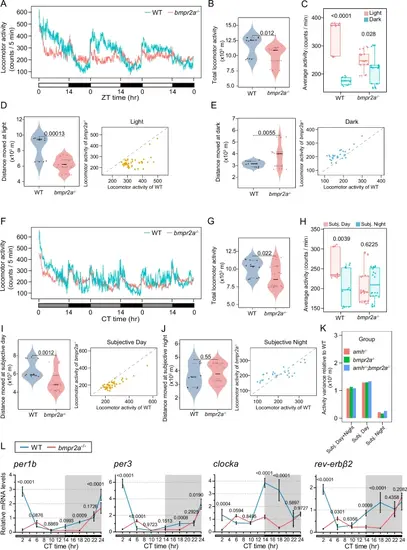
Knockout of bmpr2a results in disruption of the circadian clock and behavioural rhythms, which are similar to those of amh mutants.The locomotor activities were monitored and analyzed in the bmpr2a−/− mutants and corresponding WT female zebrafish under LD (A–E) and DD (F–J) conditions. The total locomotor activities in 72 h (B, G), the quantification of average activities (C, H), and the moving distance and activity during the light-phase (D), dark-phase (E), subjective day (I) or subjective night (J) were shown. In the waveforms of locomotor activities, each point was calculated from the 5 min binned data across 3 days. For violin plots, dots and triangle correspond to individual zebrafish and the black and grey horizontal lines display the median as well as 25th and 75th percentiles. The box-and-whisker plots were presented as interquartile ranges with the median indicated by a line and whiskers extending from the minimum to the maximum values. For B–E n = 12 (WT) and n = 20 (bmpr2a−/−), G–J n = 12 (WT) and n = 24 (bmpr2a−/−). Statistical analysis was performed using two-sided unpaired t-test. K The quantification of the activity variance relative to respective WT among the amh−/−, bmpr2a−/−, or amh−/−;bmpr2a−/− mutants. L Cyclic expression of core clock genes in pituitaries harvested at the seven indicated time points across 24 h under DD condition from WT and bmpr2a−/− females. Target gene expression levels are shown relative to the beta-actin 2 reference gene actb2. The expression of WT CT22 was used for normalization. Data are plotted as mean values ± SD, n = 3, two-sided unpaired t-test. ZT represents zeitgeber time, where ZT 0 corresponds to lights on; CT represents circadian time. Source data are provided as a Source Data file. |
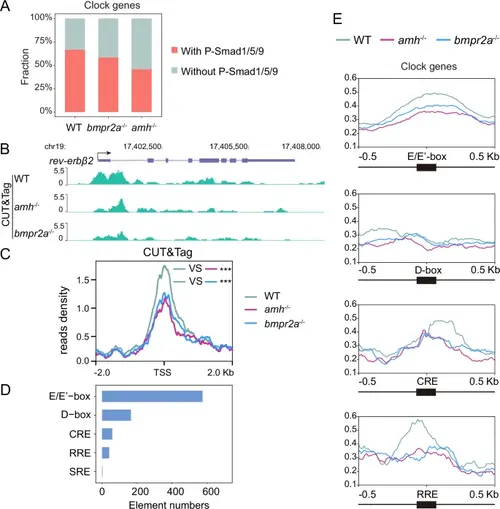
Extensive transcriptional regulation of circadian clock genes by Amh/Bmpr2a-Smad1/5/9 signalling.A Column chart showing the percentages of circadian clock genes bound by P-Smad1/5/9 revealed by the CUT&Tag assay in pituitaries from WT, amh−/− and bmpr2a−/− mutants. B UCSC Genome Browser tracks of CUT&Tag signals at circadian clock genes, such as the rev-erbβ2 loci. C Metagene analysis showing the CUT&Tag signals of P-Smad1/5/9 at circadian clock gene promoters in WT, amh−/− and bmpr2a−/− pituitaries. Two-sided unpaired t-test, ***p = 1.568e-08 (WT vs amh−/−), ***p = 5.546e-05 (WT vs bmpr2a−/−). TSS, transcription start site. D The numbers of typical clock gene cis-regulatory elements bound by P-Smad1/5/9. E Global profile of P-Smad1/5/9 at typical cis-regulatory elements of clock genes. |
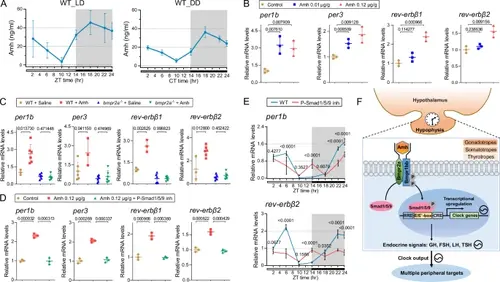
Amh signal is transduced via Bmpr2a-Smad1/5/9 pathway to regulate the circadian rhythms.A The expression rhythm of Amh in WT zebrafish. B Quantitative real-time PCR analysis of core clock genes in pituitaries after treatment with different concentrations of recombinant Amh or saline as a control. The expression of control group was used for normalization. C Expression levels of clock genes in pituitaries after treatment with recombinant Amh in WT and bmpr2a−/− mutants. The expression of WT + saline group was used for normalization. D Expression levels of core clock genes in pituitaries after treatment with recombinant Amh, Amh + P-Smad1/5/9 inhibitor or saline as a control. The expression of control group was used for normalization. E The oscillation of clock gene expression in the WT pituitaries when P-Smad1/5/9 is inhibited. The expression of WT ZT2 was used for normalization. All the data are presented as mean values ± SD, and the individual data points are depicted (n = 3, part of n = 6 in (C)). Statistical analysis was performed using two-sided unpaired t-test. F A schematic model depicting the role of Amh/Bmpr2a-Smad1/5/9 signalling pathway in the regulation of circadian rhythms. We propose that Amh signalling regulates the oscillation of molecular clock in the hypophysis in a cell type-specific manner, thereby accurately gating the major output pathway of circadian information. Amh signalling deficiency causes corresponding circadian endocrine and behavioural rhythm disorders. Source data are provided as a Source Data file. |