
|
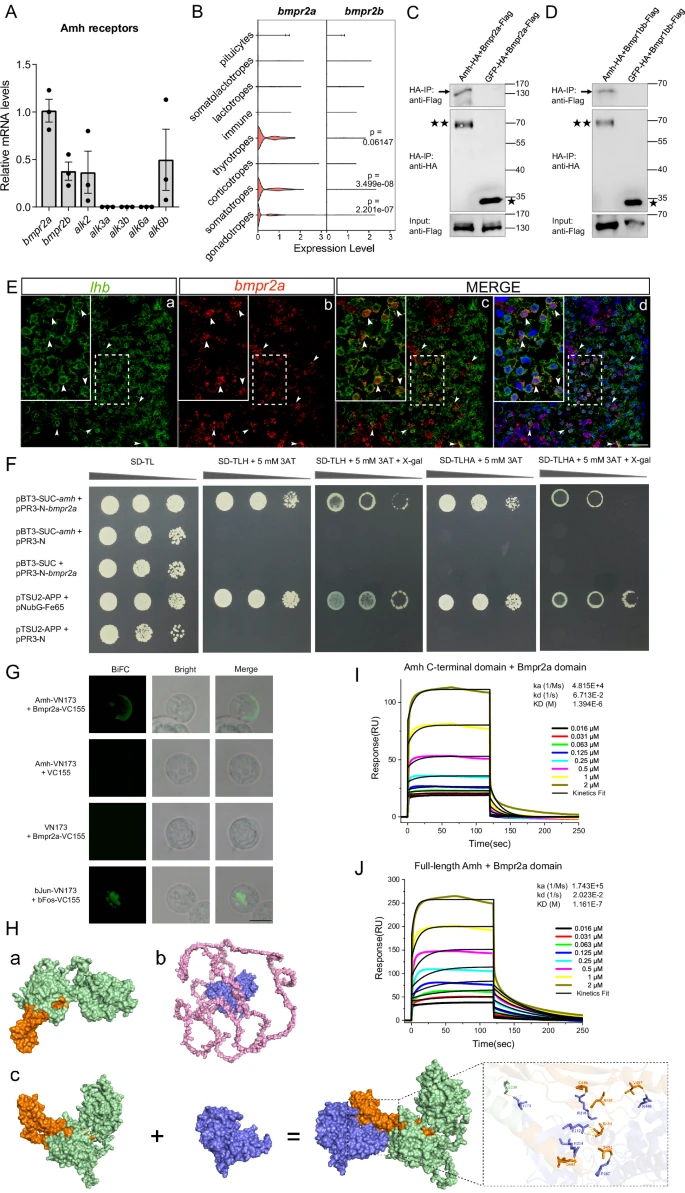
Fig. 4 Amh binds to its Bmpr2a/Bmpr1bb receptors in zebrafish.A Relative mRNA expression of candidate receptors of Amh in the isolated Amh-positive pituitary cells determined by quantitative real-time PCR analyses. The expression of bmpr2a was used for normalization. Data are plotted as mean ± SEM, n = 3. B The expression level distributions of candidate type II receptor genes are shown as violin plots across WT pituitary cell clusters. The p-value was calculated using the two-sided unpaired Wilcoxon test. C, D Amh-HA or GFP-HA was cotransfected with Bmpr2a-Flag and Bmpr1bb-Flag into 293T cells. Cell lysates were immunoprecipitated using anti-HA Dynabeads and analysed by Western blotting. E Representative images: double labelling of bmpr2a (red) and lhb (green) in WT pituitary sections by fluorescent in situ hybridization, in triplicate. Scale bars, 25 μm. F The Y2H assays showing the interaction between Amh and Bmpr2a. G Amh interacted with Bmpr2a in BiFC assays, in triplicate. Scale bars, 10 μm. H The 3D structures of Amh (a) and Bmpr2a (b), (c) the molecular docking analysis between Amh and Bmpr2a. I-J The SPR analysis for binding kinetics between Bmpr2a domain and Amh C-terminal domain (I) or the full-length Amh (J). SPR response profile for Bmpr2a at different concentrations with sensor-immobilized Amh C-terminal domain or the full-length Amh. ka, association rate constant; kd, dissociation rate constant; KD, dissociation constant. Source data are provided as a Source Data file.