
Fig. 2
- ID
- ZDB-FIG-250602-34
- Publication
- Lin et al., 2025 - Anti-Müllerian hormone signalling sustains circadian homeostasis in zebrafish
- Other Figures
- All Figure Page
- Back to All Figure Page
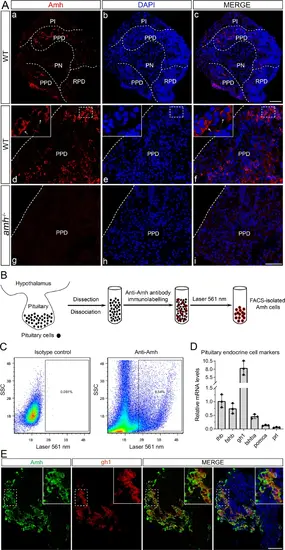
Amh protein distribution and Amh-positive cell identification in the pituitary gland.A Representative images: pituitary sections of adult WT and amh−/− female zebrafish immunolabelled with antiserum against Amh, in triplicate. B Schematic illustration of the isolation of Amh-immunolabelled pituitary cells from adult WT female zebrafish by fluorescence-activated cell sorting (FACS). C Representative scatterplots showing the staining of pituitary cells with anti-Amh and its isotype control. D Relative mRNA expression of endocrine cell marker genes in isolated Amh-positive pituitary cells. The expression of lhb was used for normalization. Data are presented as mean values ± SD and the individual data points are depicted (n = 3). E Representative images: double staining of WT pituitary sections by immunofluorescence staining of Amh (in green) and fluorescence in situ hybridization of gh1 (in red), a marker of somatotropes, in triplicate. PN pars nervosa, PI pars intermedia, PPD proximal pars distalis, RPD rostral pars distalis, DAPI 4’,6-diamidino-2-phenylindole. Scale bars, 50 μm. Source data are provided as a Source Data file. |