FIGURE SUMMARY
Title

Seizure-like behavior and hyperactivity in napb knockout zebrafish as a model for autism and epilepsy

Authors
Shin, K.C., Hasan, W., Ali, G., Abdelrahman, D., Abuarja, T., Stanton, L.W., Da'as, S.I., Park, Y.
Source
Full text @ Sci. Rep.

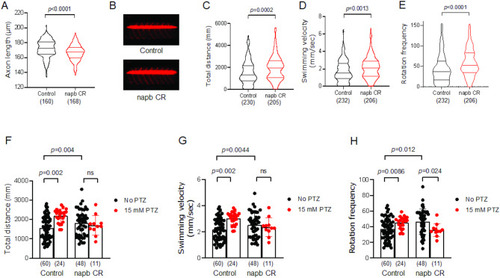
Hyperactivity and seizure-like phenotype of napb CR. (A) Axon length measured for 7 axons per embryo. (B) Representative lateral zebrafish larva images of control and napb knockout (KO) crispants (CR). (C) Total distance and (D) velocity of larvae were calculated using Ethovision software (Noldus Technologies). (E) Rotation frequency of larvae, defined as the number of clockwise and/or counterclockwise rotations with a threshold of 45° and a minimum distance of 1 mm. For panels A-E, violin plots display the median and quartiles. The number of larvae tested is shown in parentheses, and statistical analysis was performed using an unpaired two-tailed t-test. Outliers were excluded in (A). (F-H) PTZ induces seizures in control zebrafish larvae: (F) Total distance, (G) swimming velocity, and (H) rotation frequency of control larvae in the presence or absence of 15 mM PTZ. Data (F-H) are means ± SD. The number of larvae tested is shown in parentheses. Two-way ANOVA test with post-hoc Tukey was applied to analyze the effects of two independent categorical variables, i.e., napb CR and PTZ (F, G). Welch and Brown-Forsythe one-way ANOVA test was used to determine statistically significant differences between three or more independent groups (H).

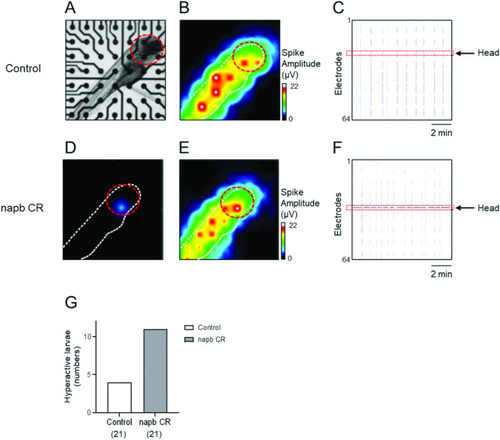
Electrical hyperexcitability in napb CR. Neural activity and neural network were monitored using MEA. (A) Inverted microscope image of a control zebrafish larva, laterally immobilized on the electrodes of MEA plates. (B) Heat map of spontaneous spike amplitude (µV) of a control zebrafish, showing that detected extracellular activity aligns with the zebrafish’s orientation (white dot). The red circle indicates the head region. (C) Well-wide raster plot illustrating synchronized spinal cord and brain neural activity in the control zebrafish. The red dotted line indicates neural activity in the brain region. (D-F) Hyperactive neural activity of napb CR. (D, E) Heat map of spontaneous spike amplitude (µV) and (F) raster plot of napb CR. (G) The number of zebrafish larvae exhibiting hyperactive neural activity in the brain region; control (n = 21) and napb CR (n = 21).

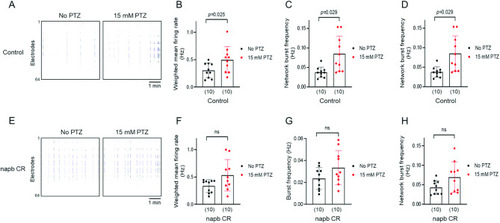
Seizure-like hyperexcitability induced by PTZ. Seizure-like neural hyperactivity was monitored using MEA. The neural activity of zebrafish larvae was recorded before and after treatment with 15 mM PTZ. (A) Raster plots of neural activity in control larvae before and after treatment with 15 mM PTZ. (B-D) Comparison of neural activity in zebrafish larvae in the absence or presence of 15 mM PTZ: control larvae (B-D) and napb CR (E-H). Quantification of (B, F) weighted mean firing rate (Hz), (C, G) burst frequency (Hz), and (D, H) network burst frequency of neural network (Hz). Data are presented as means ± SD for control larvae (B-D, n = 10) and napb CR (F-H, n = 10). The number of larvae tested is shown in parentheses. Repeated measure one-way ANOVA was used for statistical analysis to compare paired groups before and after PTZ treatment.

Acknowledgments
This image is the copyrighted work of the attributed author or publisher, and ZFIN has permission only to display this image to its users. Additional permissions should be obtained from the applicable author or publisher of the image. Full text @ Sci. Rep.