IMAGE

Fig. 1

ID
ZDB-IMAGE-250501-31
Source
Figures for Shin et al., 2025
Image
Figure Caption

Fig. 1

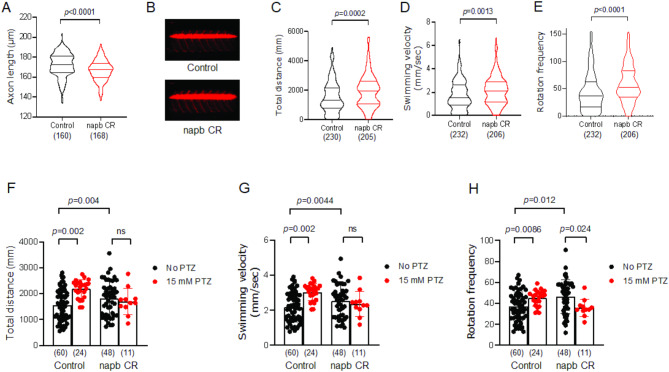
Hyperactivity and seizure-like phenotype of napb CR. (A) Axon length measured for 7 axons per embryo. (B) Representative lateral zebrafish larva images of control and napb knockout (KO) crispants (CR). (C) Total distance and (D) velocity of larvae were calculated using Ethovision software (Noldus Technologies). (E) Rotation frequency of larvae, defined as the number of clockwise and/or counterclockwise rotations with a threshold of 45° and a minimum distance of 1 mm. For panels A-E, violin plots display the median and quartiles. The number of larvae tested is shown in parentheses, and statistical analysis was performed using an unpaired two-tailed t-test. Outliers were excluded in (A). (F-H) PTZ induces seizures in control zebrafish larvae: (F) Total distance, (G) swimming velocity, and (H) rotation frequency of control larvae in the presence or absence of 15 mM PTZ. Data (F-H) are means ± SD. The number of larvae tested is shown in parentheses. Two-way ANOVA test with post-hoc Tukey was applied to analyze the effects of two independent categorical variables, i.e., napb CR and PTZ (F, G). Welch and Brown-Forsythe one-way ANOVA test was used to determine statistically significant differences between three or more independent groups (H).

Acknowledgments
This image is the copyrighted work of the attributed author or publisher, and ZFIN has permission only to display this image to its users. Additional permissions should be obtained from the applicable author or publisher of the image. Full text @ Sci. Rep.