FIGURE

Fig. 2

ID
ZDB-FIG-250501-29
Publication
Shin et al., 2025 - Seizure-like behavior and hyperactivity in napb knockout zebrafish as a model for autism and epilepsy
Other Figures
All Figure Page
Back to All Figure Page
Fig. 2

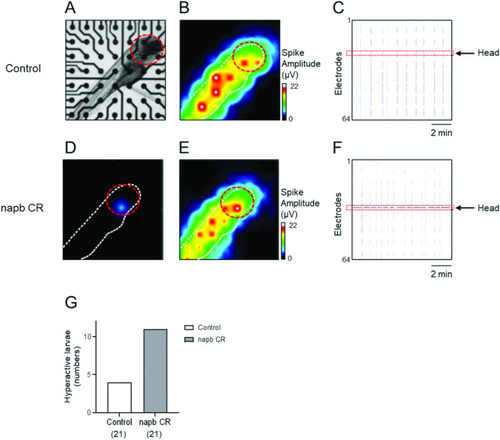
Electrical hyperexcitability in napb CR. Neural activity and neural network were monitored using MEA. (A) Inverted microscope image of a control zebrafish larva, laterally immobilized on the electrodes of MEA plates. (B) Heat map of spontaneous spike amplitude (µV) of a control zebrafish, showing that detected extracellular activity aligns with the zebrafish’s orientation (white dot). The red circle indicates the head region. (C) Well-wide raster plot illustrating synchronized spinal cord and brain neural activity in the control zebrafish. The red dotted line indicates neural activity in the brain region. (D-F) Hyperactive neural activity of napb CR. (D, E) Heat map of spontaneous spike amplitude (µV) and (F) raster plot of napb CR. (G) The number of zebrafish larvae exhibiting hyperactive neural activity in the brain region; control (n = 21) and napb CR (n = 21).

Expression Data

Expression Detail
Antibody Labeling
Phenotype Data

Phenotype Detail
Acknowledgments
This image is the copyrighted work of the attributed author or publisher, and ZFIN has permission only to display this image to its users. Additional permissions should be obtained from the applicable author or publisher of the image. Full text @ Sci. Rep.