
- Title
-
Phyto-Sesquiterpene Lactones Prevent the Development of Multidrug Resistance in TNBC via ABC Transporters Inhibition and STAT3/MYC Signaling
- Authors
- Chang, Y.T., Wu, I.T., Lee, C.H., Hung, C.C.
- Source
- Full text @ Cancers
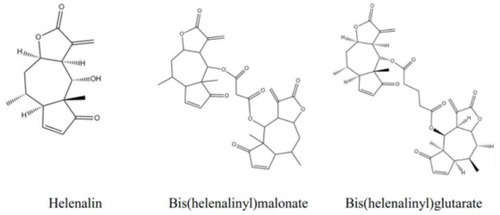
Structure of helenalin, BHM, and BHG. |
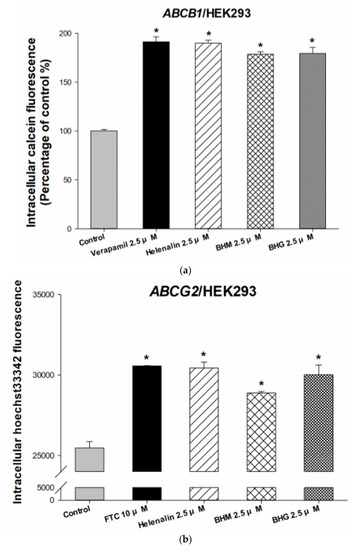
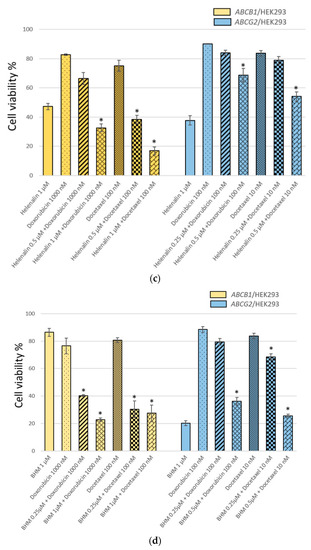
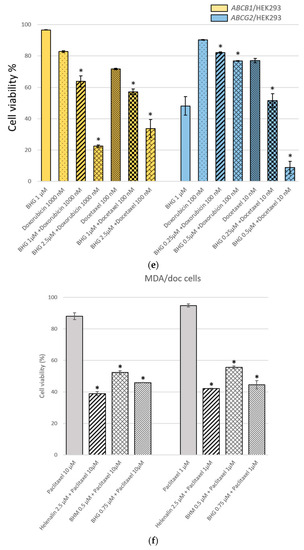
Inhibition abilities and chemosensitizing effects of helenalin, BHM, and BHG on ABC transporters in |
Inhibition abilities and chemosensitizing effects of helenalin, BHM, and BHG on ABC transporters in |
Inhibition abilities and chemosensitizing effects of helenalin, BHM, and BHG on ABC transporters in |
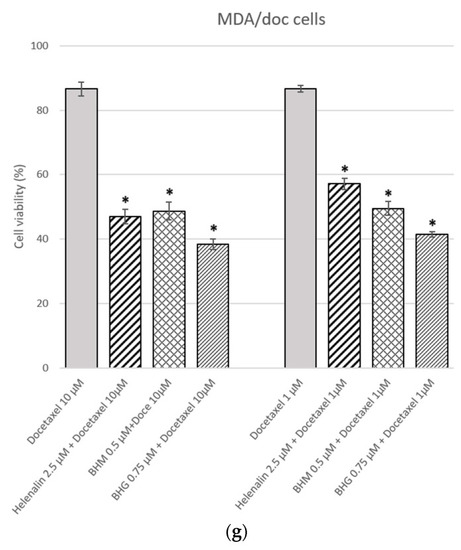
Inhibition abilities and chemosensitizing effects of helenalin, BHM, and BHG on ABC transporters in |
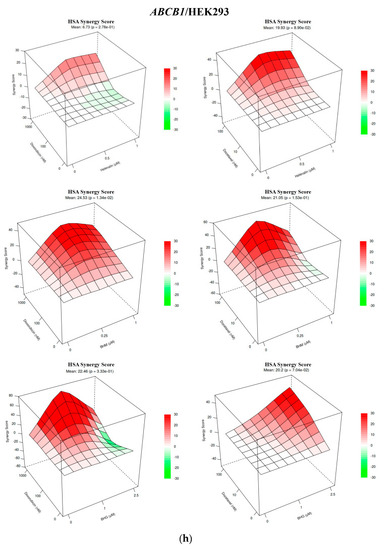
Inhibition abilities and chemosensitizing effects of helenalin, BHM, and BHG on ABC transporters in |
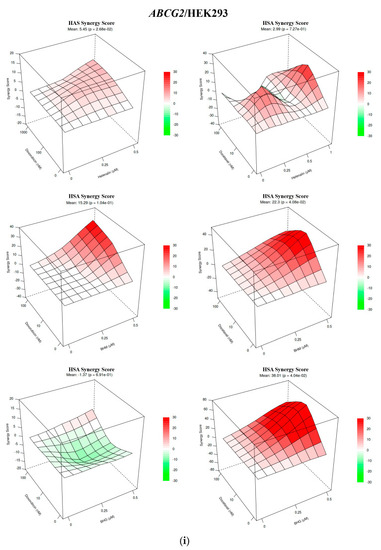
Inhibition abilities and chemosensitizing effects of helenalin, BHM, and BHG on ABC transporters in |
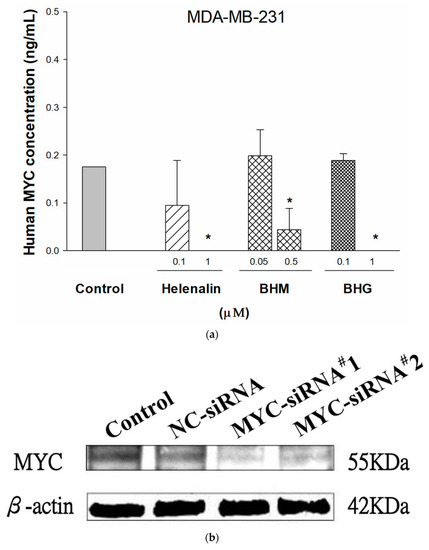
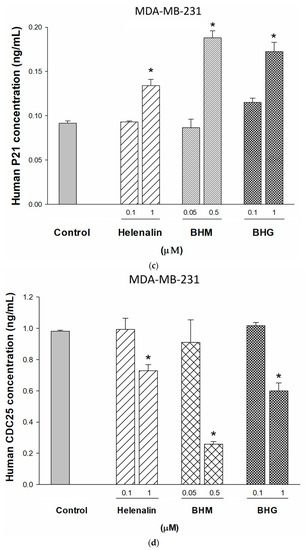
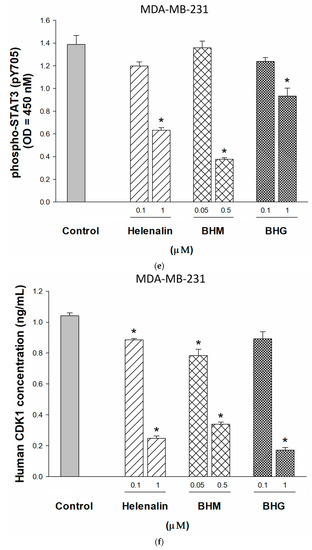
The effects of helenalin, (helenalinyl)malonate (BHM), and bis(helenalinyl)glutarate (BHG) on cell proliferation of MDA-MB-231 through MYC-dependent pathway. ( |
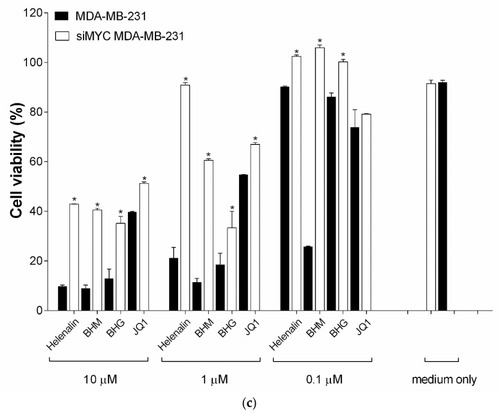
The effects of helenalin, (helenalinyl)malonate (BHM), and bis(helenalinyl)glutarate (BHG) on cell proliferation of MDA-MB-231 through MYC-dependent pathway. ( |
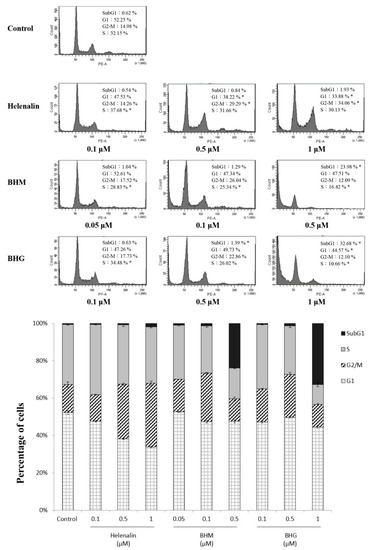
The effects of helenalin, BHM, and BHG on cell cycle in MDA-MB-231 cells. Helenalin, BHM, and BHG significantly induced MDA-MB-231 cell arrest in the G2/M phase and subG1 phase, respectively. * represented |
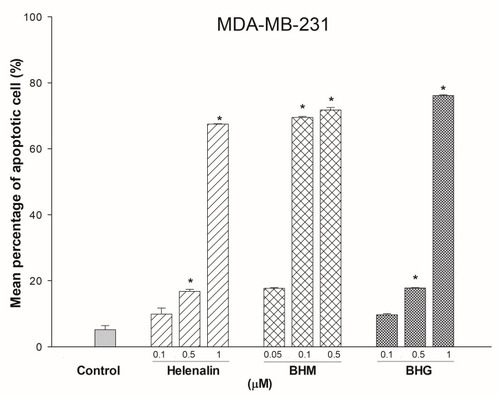
The effects of BHM, and BHG on MDA-MB-231 cells apoptosis. All three test compounds increased apoptotic cells in MDA-MB-231. * represented |
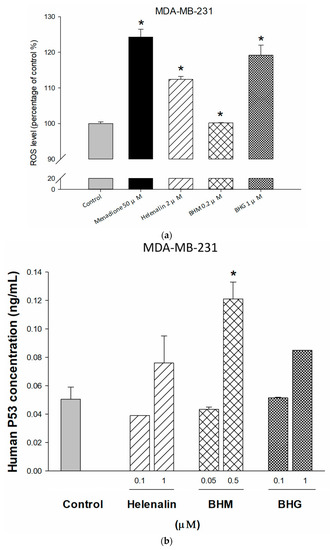
The underlying mechanism of apoptosis and G2/M arrest was determined by ROS assay and ELISA. The apoptotic cell-induced effects of helenalin, BHM, and BHG were detected by increasing ROS levels ( |
The underlying mechanism of apoptosis and G2/M arrest was determined by ROS assay and ELISA. The apoptotic cell-induced effects of helenalin, BHM, and BHG were detected by increasing ROS levels ( |
The underlying mechanism of apoptosis and G2/M arrest was determined by ROS assay and ELISA. The apoptotic cell-induced effects of helenalin, BHM, and BHG were detected by increasing ROS levels ( |
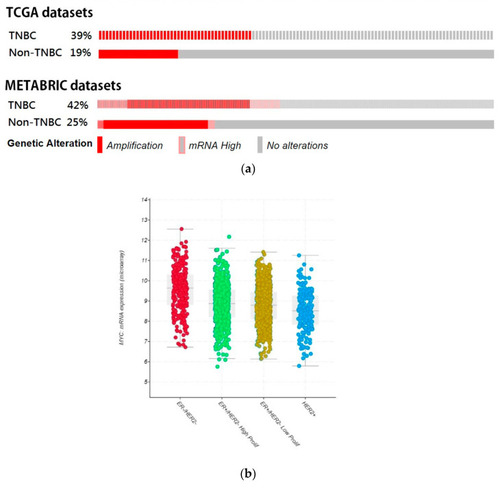
Bioinformatics analysis of the expression of MYC and its regulating pathway in the TNBC patients. ( |
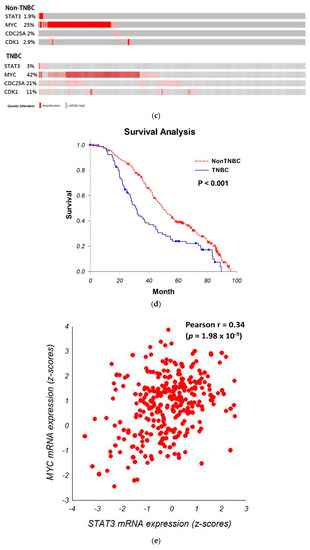
Bioinformatics analysis of the expression of MYC and its regulating pathway in the TNBC patients. ( |
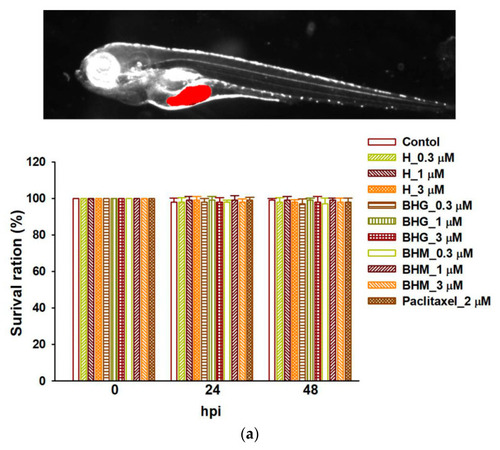
Helenalin, BHM, and BHG suppressed TNBC tumor growth in the xenotransplantation model. ( |
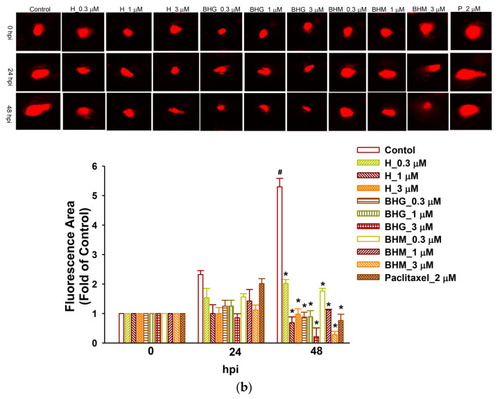
Helenalin, BHM, and BHG suppressed TNBC tumor growth in the xenotransplantation model. ( |