IMAGE

Figure 7

ID
ZDB-IMAGE-250429-3
Source
Figures for Chang et al., 2025
Image
Figure Caption

Figure 7

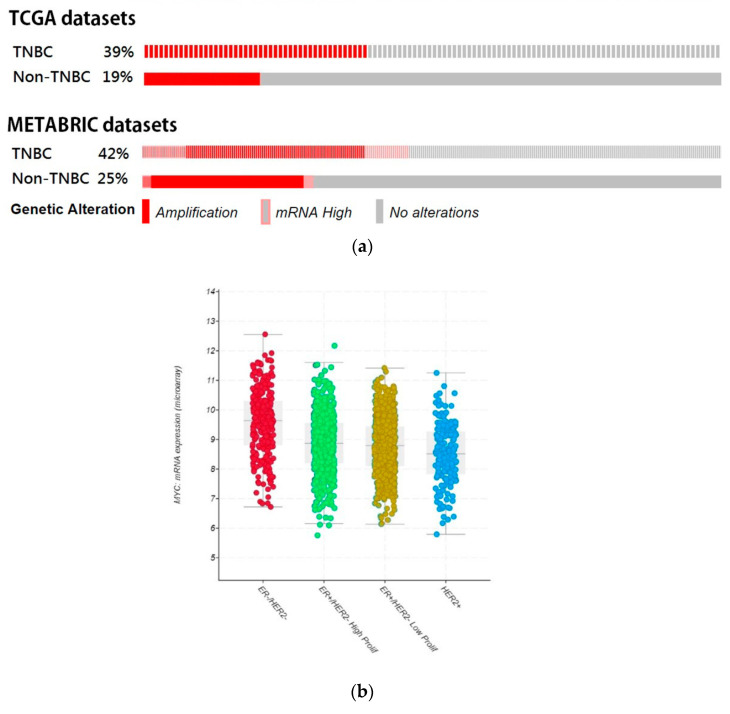
Bioinformatics analysis of the expression of MYC and its regulating pathway in the TNBC patients. (a) The oncoprint analysis of MYC amplification or mRNA upregulation in the TNBC cohort and non-TNBC cohort from TCGA and METABRIC breast cancer datasets. (b) MYC mRNA expression was detected in breast cancer according to the 3-gene classifier subtype. (c) The oncoprint analysis of STAT3, MYC, CDC25, and CDK1 in the TNBC cohort and non-TNBC cohort from METABRIC breast cancer datasets. (d) Kaplan–Meier survival analysis of patients with alterations in query genes. (e) Pearson’s correlation of STAT3 and MYC expression in the TNBC cohort.

Acknowledgments
This image is the copyrighted work of the attributed author or publisher, and ZFIN has permission only to display this image to its users. Additional permissions should be obtained from the applicable author or publisher of the image. Full text @ Cancers