
- Title
-
A Rapid F0 CRISPR Screen in Zebrafish to Identify Regulator Genes of Neuronal Development in the Enteric Nervous System
- Authors
- Davidson, A.E., Straquadine, N.R.W., Cook, S.A., Liu, C.G., Nie, C., Spaulding, M.C., Ganz, J.
- Source
- Full text @ Neurogastroenterol. Motil.
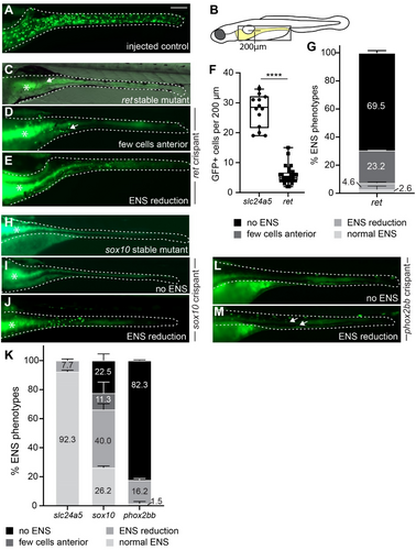
F0 crispants targeting ret, sox10, or phox2bb recapitulate known ENS phenotypes. (A?E) F0 crispants targeting ret phenocopy the lack of phox2bb:GFP+ ENS cells (green) in stable ret mutant larvae (C) in comparison to wildtype-level ENS cells in control larvae (A). Compare ENS phenotypes between (C) and (D), arrows point to remaining ENS neurons in the anterior gut. (E) A small portion of ret F0 crispants show ENS cell reduction (B) Schematic of zebrafish larvae, the gray boxed area indicates the area shown in A-M. Line indicates length used for quantification of anterior neuron numbers in ret crispants in (F). (F) Significantly fewer GFP+ cells are present within 200 um of anterior gut in ret F0 crispants compared to control injected larvae (p? |

F0 CRISPR screen identifies new regulators of ENS neurogenesis. The screening pipeline is designed to be performed within 10?days. (A) Schematic of zebrafish larvae, the boxed area indicates the area shown in B?G?. (B) Uninjected control and (C) slc24a5 F0 crispants show wildtype levels of GFP+ ENS neurons (green) at 6 dpf. (D, F, G) F0 crispants at 6 dpf with fewer GFP+ cells targeting jarid2a?+?jarid2b (pool 1), mycn?+?foxj2?+?foxj3 (pool3), dlx1a?+?foxn3?+?phox2a (pool 4), but not (E) homeza?+?homezb (pool 2). F0 crispants, which target each gene individually from the three pools with ENS phenotypes, show fewer GFP+ cells for jarid2a (D?), mycn (F?), foxj3 (F?), dlx1a (G?) and phox2a (G?), but not jarid2b (D?), foxj2 (F?), and foxn3 (G?). (H) Average percentage of F0 crispants with and without reduced ENS phenotypes for each pool and each individual gene (??2 experiments, % shown as mean?�?SEM). The dashed line shows the percent phenotypes for the slc24a5 control F0 crispants. Asterisks show a consistent and significant difference using an unpaired t-test (p? |

Secondary assays analyzing enteric progenitor cell migration and intestinal transit in F0 crispants. (A, top) slc24a5 F0 crispant control and embryo schematic (A, bottom) show the bilateral streams of GFP+ enteric progenitor cells (EPCs, green) migrating posteriorly to populate the gut. The gray box outlines the region of the embryo (A, top) and scale bar denotes the distance measured between the EPC migration front and the end of the gut (migration progress). (B) Quantification of migration progress in F0 crispants for jarid2a, dlx1a, and mycn compared to F0 slc24a5 crispant controls showed no significant (ns) difference (two experiments, each data point equals one embryo). (C) Experimental set-up for the intestinal transit assay. Phenotypically sorted larvae are fed fluorescently labeled food at 6 and 7dpf. On day 7, 4?h post-feeding, larvae that have eaten are selected (?feeders?) and placed in a new dish without food. Sixteen hours later, clearance of labeled food from the gut is determined. In sox10 mutants (E) and jarid2a F0 crispants (F) fluorescently labeled food (green) is still visible in the guts compared to the cleared guts of controls (D). (G) Quantification of percent larvae with cleared guts (??2 experiments, % shown as mean?�?SEM, each data point equals one experiment, each experiment ??6 larvae). sox10 mutants and jarid2a F0 crispants have significantly lower percentages of larvae with cleared guts compared to controls. Asterisks show a significant difference to controls using an unpaired t-test (p? |
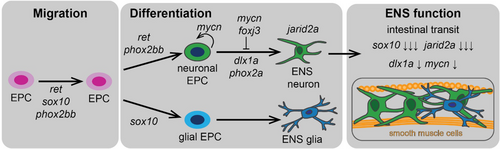
Working model for functions of candidate genes with reduced ENS neurons. The working model combines our F0 screen results with known roles in neuronal development. Based on this, we propose which steps and stages of ENS neuronal development (migration or differentiation) and ENS function the different genes regulate. |