
|
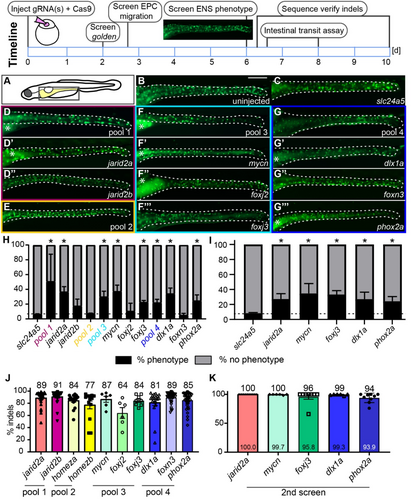
Fig. 2 F0 CRISPR screen identifies new regulators of ENS neurogenesis. The screening pipeline is designed to be performed within 10 days. (A) Schematic of zebrafish larvae, the boxed area indicates the area shown in B–G‴. (B) Uninjected control and (C) slc24a5 F0 crispants show wildtype levels of GFP+ ENS neurons (green) at 6 dpf. (D, F, G) F0 crispants at 6 dpf with fewer GFP+ cells targeting jarid2a + jarid2b (pool 1), mycn + foxj2 + foxj3 (pool3), dlx1a + foxn3 + phox2a (pool 4), but not (E) homeza + homezb (pool 2). F0 crispants, which target each gene individually from the three pools with ENS phenotypes, show fewer GFP+ cells for jarid2a (D′), mycn (F′), foxj3 (F‴), dlx1a (G′) and phox2a (G‴), but not jarid2b (D″), foxj2 (F″), and foxn3 (G″). (H) Average percentage of F0 crispants with and without reduced ENS phenotypes for each pool and each individual gene (≥ 2 experiments, % shown as mean ± SEM). The dashed line shows the percent phenotypes for the slc24a5 control F0 crispants. Asterisks show a consistent and significant difference using an unpaired t-test (p < 0.05) to slc24a5 F0 crispant controls. (I) Average percentage of F0 crispants with and without reduced ENS phenotypes for second screen using two additional gRNAs for the individual genes with a phenotype (≥ 2 experiments, % shown as mean ± SEM). The dashed line shows the percent phenotypes for the slc24a5 control F0 crispants. Asterisks show a consistent and significant difference to slc24a5 F0 crispant controls using an unpaired t-test (p < 0.05). (J) F0 crispants for each gene show a high percentage of indels in PCR amplicons of the target area (≥ 2 experiments, % shown as mean ± SEM, each data point equals one larva). (K) F0 crispants for each gene show a high percentage of indels in PCR amplicons of the target area (2 experiments, % shown as mean ± SEM, each data point equals one larva). Asterisks: Autofluorescence in gut epithelium; dashed line: Gut outline. Scale bar = 100 μm.