
|
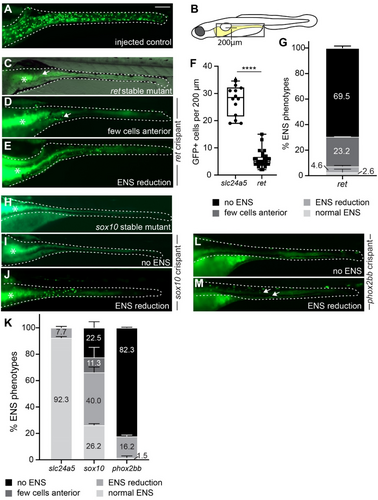
Fig. 1 F0 crispants targeting ret, sox10, or phox2bb recapitulate known ENS phenotypes. (A–E) F0 crispants targeting ret phenocopy the lack of phox2bb:GFP+ ENS cells (green) in stable ret mutant larvae (C) in comparison to wildtype-level ENS cells in control larvae (A). Compare ENS phenotypes between (C) and (D), arrows point to remaining ENS neurons in the anterior gut. (E) A small portion of ret F0 crispants show ENS cell reduction (B) Schematic of zebrafish larvae, the gray boxed area indicates the area shown in A-M. Line indicates length used for quantification of anterior neuron numbers in ret crispants in (F). (F) Significantly fewer GFP+ cells are present within 200 um of anterior gut in ret F0 crispants compared to control injected larvae (p < 0.0001, 2 experiments, % shown as mean ± SEM, each data point equals one larva). (G) % of ENS phenotypes in ret F0 crispants (2 experiments, % shown as mean ± SEM). (H–J) F0 crispants targeting sox10 (I) phenocopy the lack of GFP+ ENS cells in stable sox10 mutant larvae (H). A small portion of F0 crispants targeting sox10 show ENS cell reduction (J). (K) % of ENS phenotypes in control slc24a5, sox10, and phox2bb F0 crispants (≥ 2 experiments, % shown as mean ± SEM). (L, M) The majority of F0 crispants lack GFP+ ENS cells (L). A small portion have reduction in ENS cells (M). (A, C–E, H–J, L–M) Whole-mount side views at 6 days post fertilization (dpf). Asterisks: autofluorescence in gut epithelium; dashed line: Gut outline. Scale bar = 100 μm.