
- Title
-
Zebrafish Avatar testing preclinical study predicts chemotherapy response in breast cancer
- Authors
- Mendes, R.V., Ribeiro, J.M., Gouveia, H., Rebelo de Almeida, C., Castillo-Martin, M., Brito, M.J., Canas-Marques, R., Batista, E., Alves, C., Sousa, B., Gouveia, P., Ferreira, M.G., Cardoso, M.J., Cardoso, F., Fior, R.
- Source
- Full text @ NPJ Precis Oncol

Characterization and comparison of drug sensitivities in human BC tumor zebrafish xenografts. a Characterization of TNBC zebrafish xenografts. Hs578T and MDA-MB-468 cancer cells were labeled with DiI (red) and injected into the perivitelline space (PVS) of 2 days post-fertilization (dpf) zebrafish embryo. 4 days post-injection (dpi) zebrafish xenografts were analyzed through H&E and whole-mount immunofluorescence for Actin (phalloidin), Ki-67, apoptosis (activated caspase3) (white). b At 4dpi tumor cells can be detected at distant sites, forming micrometastasis - Hs578T: eyes (6.9%), gills (10.3% - arrowheads) or caudal hematopoietic tissue (CHT) (8,6%); MDA-MB-468: eyes (12,2%), gills (17,1% -arrowheads) or caudal hematopoietic tissue (CHT) (34%). Right panels show a zoomed-in views. c 2dpi zebrafish xenografts were treated in-vivo with epirubicin, doxorubicin, paclitaxel (PTX), docetaxel (DTX), or cyclophosphamide and compared with untreated controls. d Apoptosis (activated caspase3 in white) was analyzed and quantified (epirubicin: Apoptosis Fold Induction (AFI) Hs578T = 0.82 vs MDA-MB-468 = 1.33; doxorubicin: AFI Hs578T = 1.24 vs MDA-MB-468 = 0.83; PTX: AFI Hs578T = 0.90 vs MDA-MB-468 = 0.83; DTX: AFI Hs578T = 2.13 vs MDA-MB-468 = 1.1; Cyclop: AFI Hs578T = 1.32 vs MDA-MB-468 = 2.43) (**P = 0,0018). Data represents AVG ± SEM from 3 independent experiments. Statistical analysis was performed using Mann–Whitney test. Statistical results: (ns) > 0.05, **P < 0.01, ****P < 0.0001. White dashed line delimits the tumors. Total number of analyzed xenografts is indicated in the images. Scale bars:100 μm (H&E) and 50 μm (immunofluorescent images). All images: anterior to the left, posterior to right, dorsal up and ventral down. |
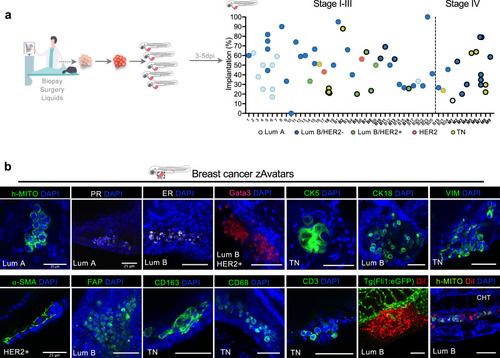
Characterization of BC zAvatars. a Workflow summarizing the zAvatar assay. Implantation rate at 3, 4, or 5dpi and the corresponding receptor status of the tumors from breast core needle biopsies, surgical samples, and liquids. Early: Lum A – 43,5%; Lum B, HER2- – 53%; Lum B, HER2+ – 36%; HER2+ – 50%; TN – 69%. Advanced: Lum A – 28,4%; Lum B, HER2- – 41%; TN – 40%. Mean implantation rates 47.2%. b Examples of zAvatars processed for whole-mount immunofluorescence to assess human-associated antigens (anti-human mitochondria), and BC biomarkers: PR, ER, Gata3, CK5, CK18, mesenchymal marker: VIM, stromal components: a-SMA, FAP, immune cells: CD163, CD68, CD3, angiogenesis and micrometastasis potential. ER-Estrogen Receptor, PR-Progesterone receptor, Vim-Vimentin, FAP-Fibroblast activation protein, a-SMA-alpha smooth muscle actin, CK-Cytokeratin, CHT-Caudal hematopoietic tissue. Labels with only numbers - surgical sample, B - breast biopsy, M – Metastatic (either biopsy of metastasis or liquids from metastatic patients). Darker circles represent samples used for matching patient’s response to therapy. Scale bars:50 μm, except if identified has otherwise. All images: anterior to the left, posterior to right, dorsal up, and ventral down. |
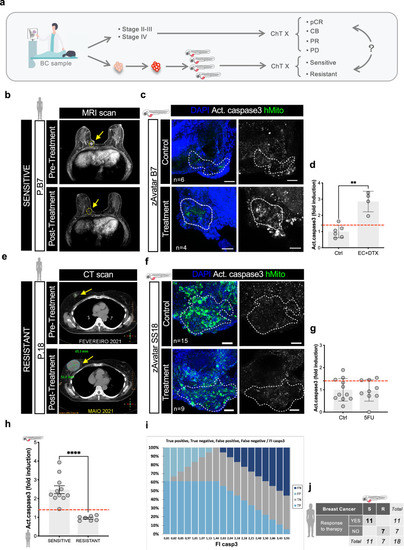
zAvatars from early and advanced BC can predict patient response to treatment. a Workflow of the clinical study. Patients’ samples were injected into zebrafish embryos, and zAvatars were subsequently treated with the same chemotherapy regimen as their respective donor-patients. Treatment responses of the zAvatars were then compared to the clinical response of their corresponding patients. b Patient MRI (P.B7) before and after treatment. c Corresponding BC zAvatars from core needle-biopsy (B7), treated in-vivo with the same ChT regimen as its donor-patient and compared with untreated controls. 3dpi zAvatars, 2 days post-treatment (dpt). d Apoptosis (activated caspase3) was analyzed and quantified. e Patient CT scans (P18) before and after treatment. f Corresponding zAvatars from surgery sample (18) treated in-vivo with the same ChT regimen as its donor-patient and compared with untreated controls. zAvatars fixed at 3dpi, 2 dpt. g Apoptosis (activated caspase3) was analyzed and quantified. h Activated Caspase3 fold induction of zAvatars and its corresponding matching patient’s response segregated according to sensitive (pCR, PR, CB) and resistant (PD). i ROC curve graph. j Confusion matrix displaying the number of patients that did responded (YES) or did not respond (NO) to the treatment, along with the corresponding zAvatar-test: SENSITIVE (S) or RESISTANT (R). Data represents AVG ± SD from one independent experiment. Each dot represents one xenograft. Red dashed line represents the threshold value of activated caspase3 induction calculated by ROC curve analysis. Statistical analysis was performed using Mann–Whitney test. Statistical results: (ns) > 0.05, **P < 0.01. pCR - pathologic complete response; PR - partial response; PD - progressive disease; CB - clinical benefit; PD – progressive disease. CT – computerized tomography; MRI – magnetic resonance imaging. 5-FU – 5-Fluorouracil. Apoptosis (activated caspase3 in white, Z-projection image). P.B – Patients’ Biopsy. Yellow arrows point to the tumors. Scale bars:50μm. All images: anterior to the left, posterior to right, dorsal up, and ventral down. |

zAvatars from early and late-stage BC recapitulate its donor-patient tumor origin. a 3dpi zebrafish Avatar showing tumor cells. b Incidence of micrometastasis in untreated zAvatars at 3-5dpi derived from early and late-stage patients (****P < 0.0001). Results are from one independent experiment. Each dot represents one xenograft and its corresponding number of disseminated cells. Bars are AVG ± SD. c Confusion matrix showing that metastatic potential correlates with tumor staging. Statistical analysis was performed using Mann–Whitney test. CHT-caudal hematopoietic tissue. All images: anterior to the left, posterior to right, dorsal up, and ventral down. |