
|
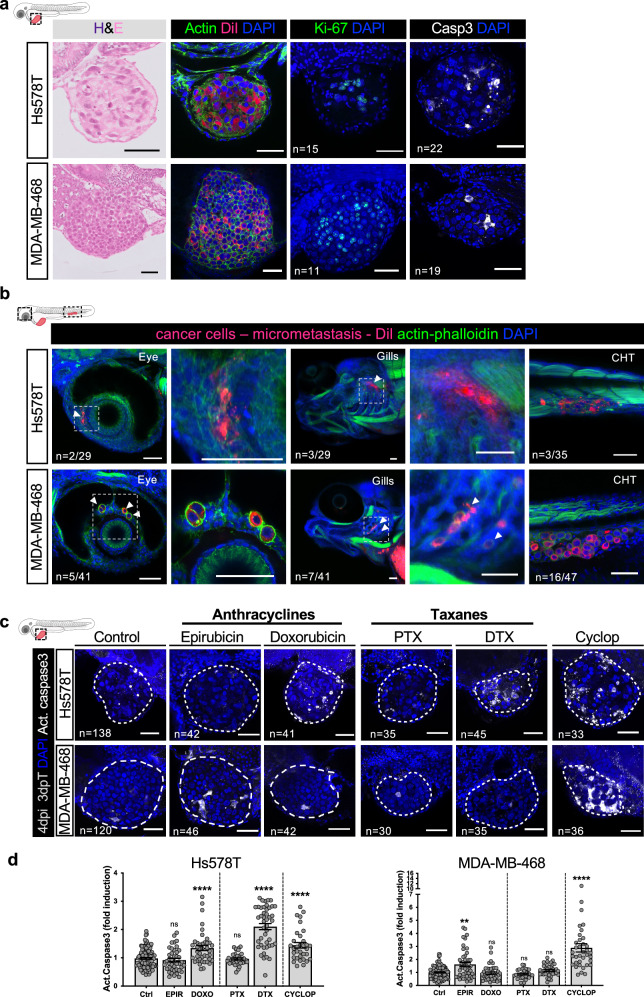
Fig. 1 Characterization and comparison of drug sensitivities in human BC tumor zebrafish xenografts. a Characterization of TNBC zebrafish xenografts. Hs578T and MDA-MB-468 cancer cells were labeled with DiI (red) and injected into the perivitelline space (PVS) of 2 days post-fertilization (dpf) zebrafish embryo. 4 days post-injection (dpi) zebrafish xenografts were analyzed through H&E and whole-mount immunofluorescence for Actin (phalloidin), Ki-67, apoptosis (activated caspase3) (white). b At 4dpi tumor cells can be detected at distant sites, forming micrometastasis - Hs578T: eyes (6.9%), gills (10.3% - arrowheads) or caudal hematopoietic tissue (CHT) (8,6%); MDA-MB-468: eyes (12,2%), gills (17,1% -arrowheads) or caudal hematopoietic tissue (CHT) (34%). Right panels show a zoomed-in views. c 2dpi zebrafish xenografts were treated in-vivo with epirubicin, doxorubicin, paclitaxel (PTX), docetaxel (DTX), or cyclophosphamide and compared with untreated controls. d Apoptosis (activated caspase3 in white) was analyzed and quantified (epirubicin: Apoptosis Fold Induction (AFI) Hs578T = 0.82 vs MDA-MB-468 = 1.33; doxorubicin: AFI Hs578T = 1.24 vs MDA-MB-468 = 0.83; PTX: AFI Hs578T = 0.90 vs MDA-MB-468 = 0.83; DTX: AFI Hs578T = 2.13 vs MDA-MB-468 = 1.1; Cyclop: AFI Hs578T = 1.32 vs MDA-MB-468 = 2.43) (**P = 0,0018). Data represents AVG ± SEM from 3 independent experiments. Statistical analysis was performed using Mann–Whitney test. Statistical results: (ns) > 0.05, **P < 0.01, ****P < 0.0001. White dashed line delimits the tumors. Total number of analyzed xenografts is indicated in the images. Scale bars:100 μm (H&E) and 50 μm (immunofluorescent images). All images: anterior to the left, posterior to right, dorsal up and ventral down.