
|
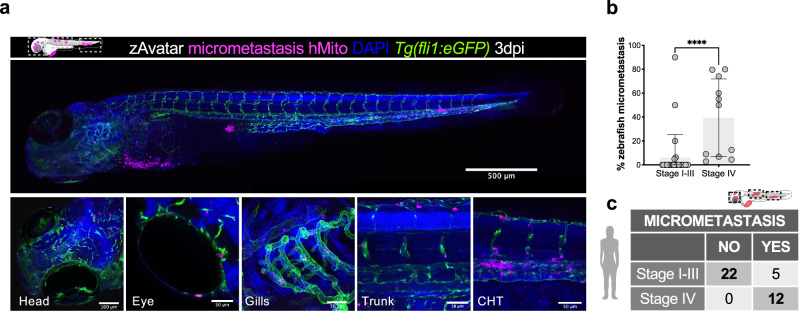
Fig. 4 zAvatars from early and late-stage BC recapitulate its donor-patient tumor origin. a 3dpi zebrafish Avatar showing tumor cells. b Incidence of micrometastasis in untreated zAvatars at 3-5dpi derived from early and late-stage patients (****P < 0.0001). Results are from one independent experiment. Each dot represents one xenograft and its corresponding number of disseminated cells. Bars are AVG ± SD. c Confusion matrix showing that metastatic potential correlates with tumor staging. Statistical analysis was performed using Mann–Whitney test. CHT-caudal hematopoietic tissue. All images: anterior to the left, posterior to right, dorsal up, and ventral down.