
Fig. 3
- ID
- ZDB-FIG-250506-26
- Publication
- Mendes et al., 2025 - Zebrafish Avatar testing preclinical study predicts chemotherapy response in breast cancer
- Other Figures
- All Figure Page
- Back to All Figure Page
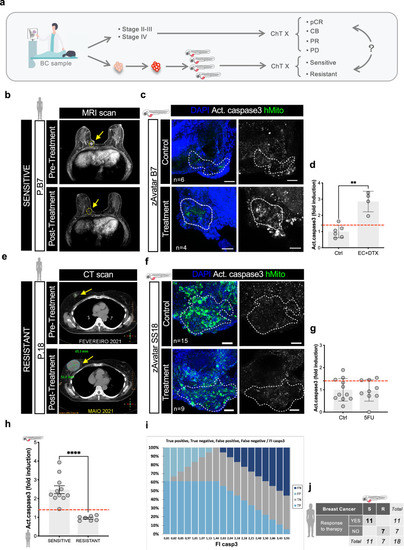
zAvatars from early and advanced BC can predict patient response to treatment. a Workflow of the clinical study. Patients’ samples were injected into zebrafish embryos, and zAvatars were subsequently treated with the same chemotherapy regimen as their respective donor-patients. Treatment responses of the zAvatars were then compared to the clinical response of their corresponding patients. b Patient MRI (P.B7) before and after treatment. c Corresponding BC zAvatars from core needle-biopsy (B7), treated in-vivo with the same ChT regimen as its donor-patient and compared with untreated controls. 3dpi zAvatars, 2 days post-treatment (dpt). d Apoptosis (activated caspase3) was analyzed and quantified. e Patient CT scans (P18) before and after treatment. f Corresponding zAvatars from surgery sample (18) treated in-vivo with the same ChT regimen as its donor-patient and compared with untreated controls. zAvatars fixed at 3dpi, 2 dpt. g Apoptosis (activated caspase3) was analyzed and quantified. h Activated Caspase3 fold induction of zAvatars and its corresponding matching patient’s response segregated according to sensitive (pCR, PR, CB) and resistant (PD). i ROC curve graph. j Confusion matrix displaying the number of patients that did responded (YES) or did not respond (NO) to the treatment, along with the corresponding zAvatar-test: SENSITIVE (S) or RESISTANT (R). Data represents AVG ± SD from one independent experiment. Each dot represents one xenograft. Red dashed line represents the threshold value of activated caspase3 induction calculated by ROC curve analysis. Statistical analysis was performed using Mann–Whitney test. Statistical results: (ns) > 0.05, **P < 0.01. pCR - pathologic complete response; PR - partial response; PD - progressive disease; CB - clinical benefit; PD – progressive disease. CT – computerized tomography; MRI – magnetic resonance imaging. 5-FU – 5-Fluorouracil. Apoptosis (activated caspase3 in white, Z-projection image). P.B – Patients’ Biopsy. Yellow arrows point to the tumors. Scale bars:50μm. All images: anterior to the left, posterior to right, dorsal up, and ventral down. |