
- Title
-
Zebrafish and cellular models of SELENON-Congenital myopathy exhibit novel embryonic and metabolic phenotypes
- Authors
- Barraza-Flores, P., Moghadaszadeh, B., Lee, W., Isaac, B., Sun, L., Hickey, E.T., Rockowitz, S., Sliz, P., Beggs, A.H.
- Source
- Full text @ Skelet Muscle

Zebrafish selenon mutants show absent or partial expression of Selenoprotein-N. (A) Sanger sequencing chromatograms show analysis of the selenon gene exon 2 for wild type (WT), selenoncl502, selenoncl503, and selenoncl504 homozygotes using genomic DNA from zebrafish tail clips. (B) Real Time qPCR analyses show selenon transcript levels at 1 dpf and 6 dpf in zebrafish knock outs (KO’s) and mutants (Mt): selenoncl502, selenoncl503, and selenoncl504with their correspondent WT. (N = 5 per group) “*” = p < 0.05, “**” = p < 0.01, “***” = p < 0.001, “****” = p < 0.0001. (C) Western Blot analysis shows SelN expression at the predicted size of ~ 65 kDa in positive control (SelN-transfected HEK cells) but not in negative control (WT HEK cells). Protein lysates from 2 dpf zebrafish selenon mutants and their corresponding WT controls show SelN expression in all WT fish, no expression in selenoncl502 and selenoncl503, and reduced expression in selenoncl504 mutant line. (N = 30 per group) (D) Ponceau staining in western blot used to demonstrate equal protein loading throughout the blot |

Selenoprotein-N deficient zebrafish embryos present with impaired spontaneous contractions. Spontanous tail and trunk contractions of zebrafish embryos were recorded and quantified at 24 hpf in SelN homozygous KO selenoncl502 (N = 45 and 29), selenoncl503 (N = 43,48), and homozygous mutant (Mt) selenoncl504 (N = 131,116) and their correspodent WT controls. (A) Mean duration of spontaneous contractions, percent time of contraction activity, and total number of contractions are reported in each line. “*” = p < 0.05, “**” = p < 0.01, “***” = p < 0.001, “****” = p < 0.0001. (B) WT, heterozygous and homozygous embryos were observed for hatching activity and recorded up until 80 hpf (N = 41–100 WT, 92–134 heterozygous, and 56–93 homozygous mutant embryos per line) PHENOTYPE:
|

Selenon-deficient zebrafish larvae show decreased activity. (A) 6 dpf WT (blue) and homozygous selenon-KO selenoncl502/cl502(red) zebrafish larvae were tested for swim activity using an activity monitor and a 90-minute protocol that included vibration (dotted lines) and cycles of alternating light (non-shaded areas) and dark (shaded areas) periods. (B) Quantification of activity assays of WT and homozygous selenon-mutant lines shows decreased total distance swum in SelN-deficient zebrafish larvae when compared to their correspondending WT controls (N = 24). “*” = p < 0.05, “***” = p < 0.001 PHENOTYPE:
|

Glutathione homeostasis is altered in cell models of SELENON-CM. (A) Selenon Knock Down (KD) cell lines show decreased gluathione ratio (GSH/GSSG) when compared to WT control. (B) GSH/GSSG ratio were measured in 6 dpf selenoncl502 (N = 9 and 7), selenoncl503 (N = 14), and selenoncl504 (N = 13 and 14) zebrafish lines. “*” = p < 0.05, “**” = p < 0.01, “***” = p < 0.001 PHENOTYPE:
|

Selenon knock down cells present increased ROS levels when compared to control. (A) Flow cytometry assay of CM-H2DCFDA stained cells to measure ROS levels in selenon knock down (KD1 and KD8) and WT control cells. (B) Quantification of fluorescence from (A) reveals significant increase of ROS levels in selenon KD cell lines when compared to control. (C) Immunoblotting of protein carbonylation and (D) nytrosylation demonstrate increased levels in selenon KD when compared to control cells |
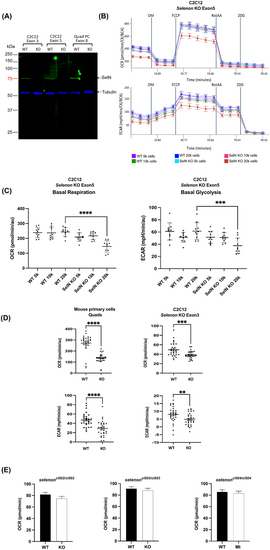
Selenoprotein-N null myoblasts show impairment in metabolism after differentiation at high cell seeding confluency. (A) Immunoblot shows absence of ~ 65 kDa SelN in three selenon-null myoblast lines: C2C12 Exon 3, C2C12 Exon 5, and mouse quadriceps primary cells (Quad PC). α-Tubulin was used as a loading control and is present at ~ 52 kDa in all lines. (B) Results from seahorse cell respirometer show changes in Oxygen Consumption Rate (OCR) and Extra Cellular Acidification Rate (ECAR) parameters at different cell plating densities of selenon-null C2C12 Exon 5 cells. (C) Quantification of OCR and ECAR in increasing concentrations of C2C12 selenon-null exon 5 myoblasts show significant differences when compared to wild type only at 20,000 cell density (N = 10). (D) Quantification of basal OCR and ECAR in C2C12 selenon-null exon 3 and one mouse quadricep primary selenon-null cell lines shows impaired metabolism in KO myoblasts when compared to WT at 20,000 cell density (N = 30). (E) Quantification of basal OCR in three 1 dpf selenon-mutant zebrafish embryos show no differences in metabolism in mutants when compared to WT (N = 48). “**” = p < 0.01, “***” = p < 0.001, “****” = p < 0.0001 PHENOTYPE:
|

Unillustrated author statements PHENOTYPE:
|