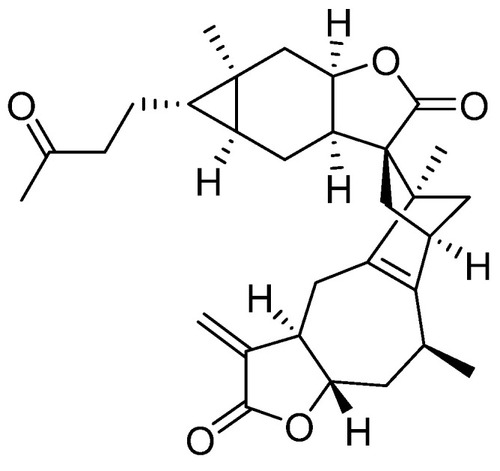
Chemical structure of faberidilactone A.

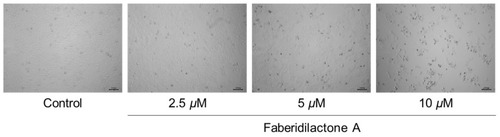
Faberidilactone A inhibits the proliferation of HepG2 cells. HepG2 cells were treated with faberidilactone A (2.5, 5, and 10 µM) for 48 h. Morphological changes in faberidilactone A-treated HepG2 cells were observed with a microscope, bar: 100 µm.

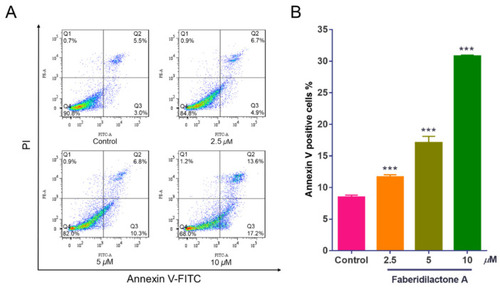
Faberidilactone A induces apoptosis in HepG2 cells. HepG2 cells were treated with different concentrations (2.5, 5, and 10 µM) of faberidilactone A for 48 h, stained with Annexin V-FITC and PI, and then the proportion of apoptotic cells was detected by flow cytometry. (A) Flow cytometry analysis of apoptosis in HepG2 cells. (B) Histogram of HepG2 apoptotic cells after 48 h of faberidilactone A treatment. All values are expressed as mean ± SD. *** p < 0.001 versus control group.

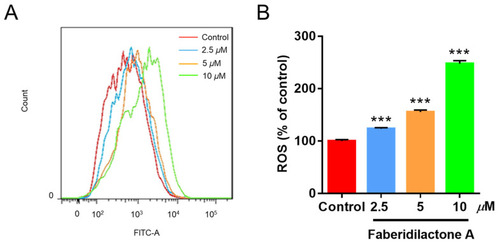
Faberidilactone A induces the accumulation of ROS in HepG2 cells. Cells were treated with different concentrations (2.5, 5, and 10 µM) of faberidilactone A for 48 h, stained with DCFH-DA, and analyzed by flow cytometry. (A) Flow cytometry analysis of changes in ROS content in HepG2 cells. (B) Histogram of relative ROS levels in HepG2 cells. All values are expressed as mean ± SD. *** p < 0.001 versus control group.

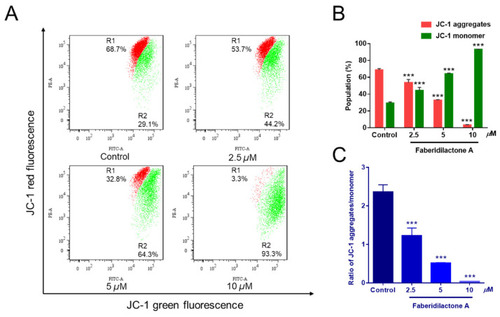
Faberidilactone A caused a decrease in MMP in HepG2 cells. Cells were treated with faberidilactone A for 48 h, stained with JC-1, and the red and green fluorescence intensity changes were detected by flow cytometry. (A) Flow cytometry to detect changes in MMP. (B) Proportion of cells containing JC-1 aggregates and JC-1 monomers. (C) Histogram of JC-1 aggregate/monomer proportions. All values are expressed as mean ± SD. *** p < 0.001 versus control group.

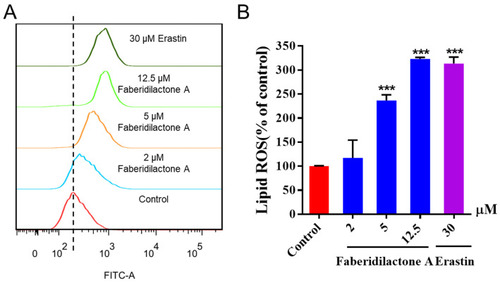
Faberidilactone A enhanced lipid ROS levels in HepG2 cells. After 48 h of treatment with different concentrations (2, 5, and 12.5 µM), cells were stained with C11 BODIPY 581/591 and analyzed by flow cytometry. (A) Flow cytometry analysis demonstrating changes in lipid ROS levels in HepG2 cells. (B) Histogram illustrating relative lipid ROS levels in HepG2 cells. All values are expressed as mean ± SD. *** p < 0.001 versus control group.

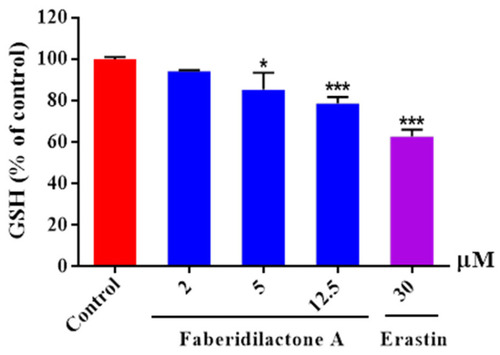
Faberidilactone A enhanced the depletion of GSH in HepG2 cells. Cells were lysed following a 24 h treatment with the drug at concentrations of 2, 5, and 12.5 µM. The absorbance of the resulting product was measured using a microplate reader, in accordance with the kit instructions. A quantitative analysis of the relative levels of GSH was performed, and all values are expressed as mean ± SD. * p < 0.05 and *** p < 0.001 versus control group.

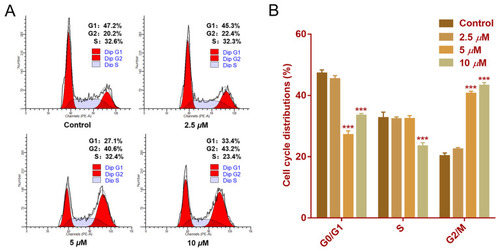
Effect of faberidilactone A on the cell cycle distribution of HepG2. HepG2 cells were treated with different concentrations (2.5, 5, and 10 µM) of faberidilactone A for 48 h. (A) Cell cycle distribution was analyzed by flow cytometry. (B) Quantitative analysis of cell cycle phases. All values are expressed as mean ± SD. *** p < 0.001 versus control group.

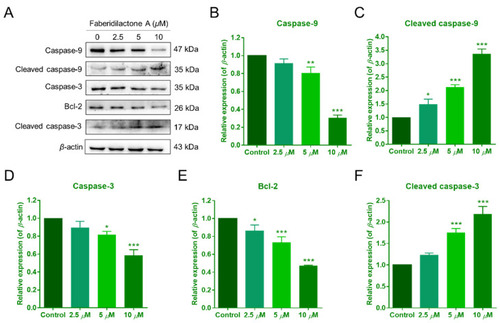
Faberidilactone A regulated the expression of apoptosis-related proteins. (A) Western blot analysis of Bcl-2, caspase-9, caspase-3, and their cleaved forms after treatment with faberidilactone A. (BF) Quantitative analysis of the relative expression levels of multiple proteins. All values are expressed as mean ± SD. * p < 0.05, ** p < 0.01, and *** p < 0.001 versus control group.

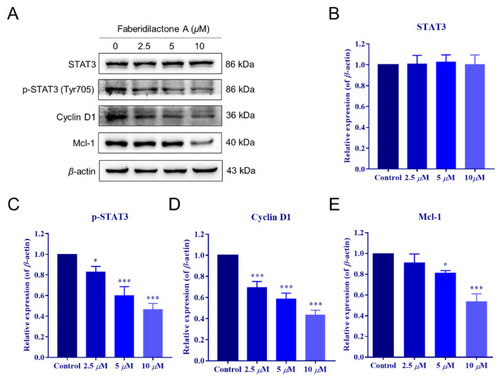
Faberidilactone A regulated the STAT3 signaling pathway. (A) Western blot analysis of STAT3, phosphorylated STAT3 (p-STAT3), cyclin D1, and Mcl-1 after faberidilactone A treatment. (BE) Normalized quantification of the relative expression levels of various proteins. All values are expressed as mean ± SD. * p < 0.05, *** p < 0.001 versus control group.

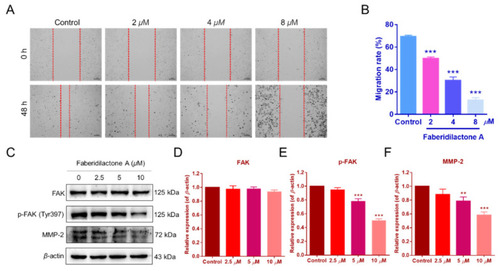
Faberidilactone A inhibited the migration of HepG2 cells and regulated the FAK signaling pathway. (A) Scratch assay images after faberidilactone A treatment. (B) Quantitative analysis of cell migration. (CF) Western blot analysis of FAK, p-FAK, and MMP-2 expression levels. All values are expressed as mean ± SD. ** p < 0.01 and *** p < 0.001 versus control group.

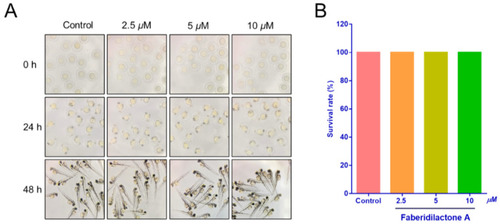
Toxicity of faberidilactone A to normal zebrafish embryos. (A) The growth of zebrafish embryos after 0, 24, and 48 h treatment with 2.5, 5, and 10 µM of faberidilactone A was observed via the microscope. (B) Statistical analysis of zebrafish survival rate after 48 h of faberidilactone A treatment.

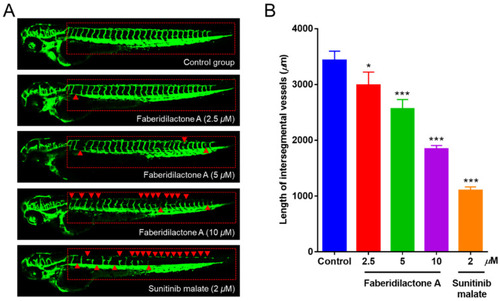
Faberidilactone A could inhibit angiogenesis in a transgenic zebrafish model. (A) Zebrafish embryos were treated with faberidilactone A and sunitinib for 48 h, and then the development of ISVs and DLAVs was observed under confocal microscopy. The red triangles in the figure indicated where the blood vessels were broken. (B) Quantitative analysis of ISVs length. All values are expressed as mean ± SD. * p < 0.05 and *** p < 0.001 versus control group.

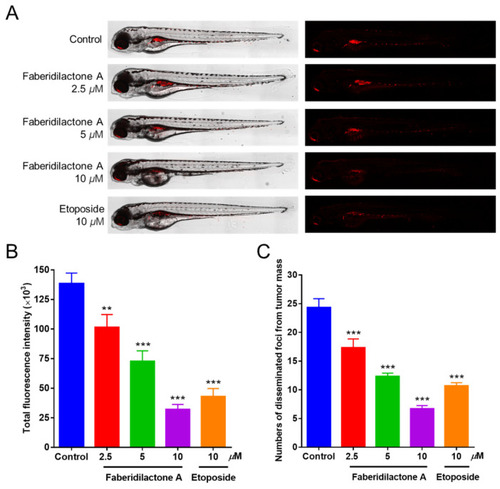
Antitumor effect of faberidilactone A in a zebrafish xenograft model. (A) Confocal images of HepG2 cell proliferation and metastasis after faberidilactone A treatment. (B) Statistical analysis of quantitative analysis of fluorescence intensity, the histogram representing the proliferative capacity of HepG2 cells. (C) Quantification of the number of metastasized fluorescence foci, representing the migration capacity of HepG2 cells. All values are expressed as the mean ± SD. ** p < 0.01 and *** p < 0.001 versus control group.

Acknowledgments
This image is the copyrighted work of the attributed author or publisher, and ZFIN has permission only to display this image to its users. Additional permissions should be obtained from the applicable author or publisher of the image. Full text @ Molecules