
Image
|
Figure Caption
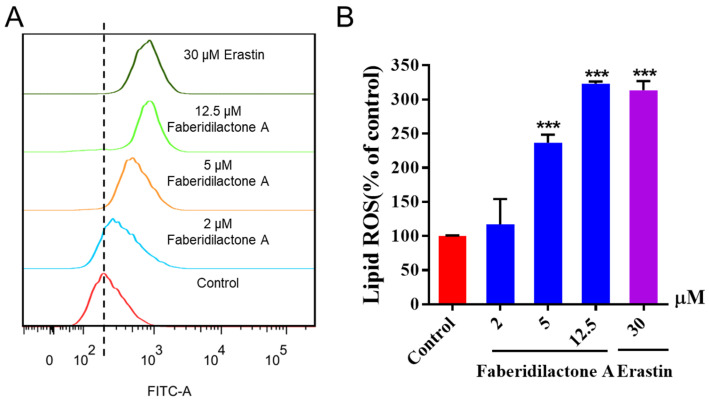
Figure 6
Faberidilactone A enhanced lipid ROS levels in HepG2 cells. After 48 h of treatment with different concentrations (2, 5, and 12.5 µM), cells were stained with C11 BODIPY 581/591 and analyzed by flow cytometry. (
Acknowledgments
This image is the copyrighted work of the attributed author or publisher, and
ZFIN has permission only to display this image to its users.
Additional permissions should be obtained from the applicable author or publisher of the image.
Full text @ Molecules