
Image
|
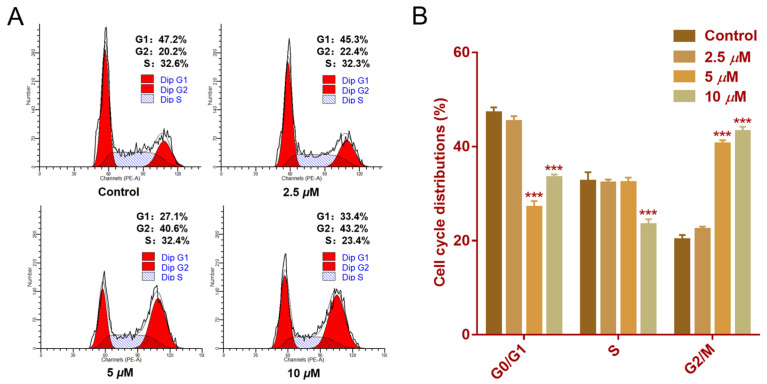
Figure Caption
Figure 8
Effect of faberidilactone A on the cell cycle distribution of HepG2. HepG2 cells were treated with different concentrations (2.5, 5, and 10 µM) of faberidilactone A for 48 h. (
Acknowledgments
This image is the copyrighted work of the attributed author or publisher, and
ZFIN has permission only to display this image to its users.
Additional permissions should be obtained from the applicable author or publisher of the image.
Full text @ Molecules