
- Title
-
Multi-omics association pattern between gut microbiota and host metabolism of a filter-feeding fish in situ exposed to microplastics
- Authors
- Huang, J.N., Gao, C.C., Ren, H.Y., Wen, B., Wang, Z.N., Gao, J.Z., Chen, Z.Z.
- Source
- Full text @ Environ. Int.
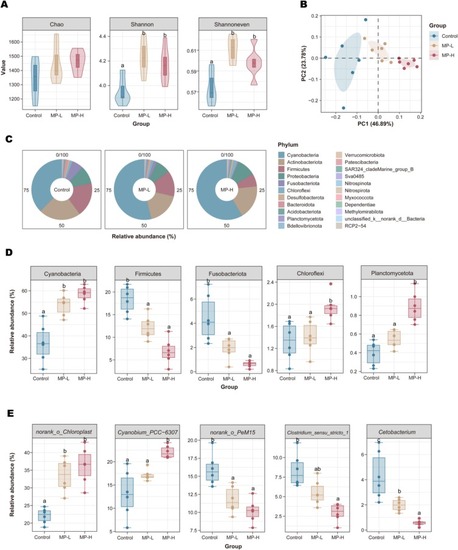
Bacterial community composition in the gut of silver carp after three-month in situ MPs exposure. Different lowercase letters indicate significant differences at p < 0.05. (A) Alpha diversity. (B) PCoA at OTU level. (C) Relative abundance of phyla. (D) Phyla with significant differences. (E) The top 5 genera with significant differences. |
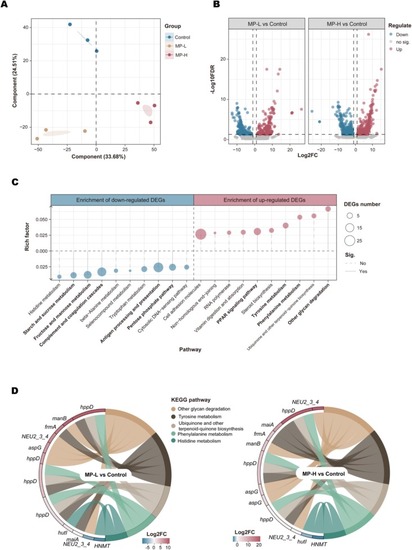
Liver transcriptome analysis of silver carp after three-month in situ MPs exposure. (A) PLS-DA of overall transcript profiles for three groups. (B) Volcano plot of DEGs between MPs-exposed groups and control. (C) KEGG functional enrichment analysis based on DEGs. (D) Expression levels of DEGs in the top five significant enrichment pathways obtained from Fig. 2C. |
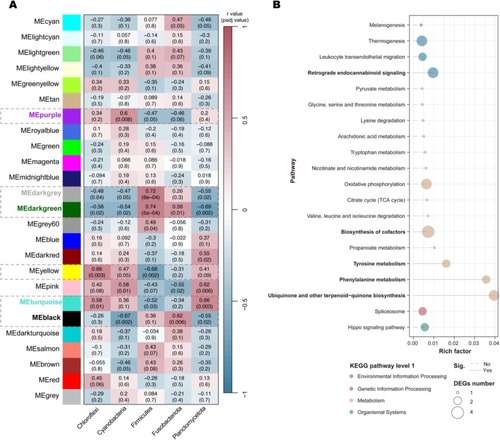
WGCNA analysis between gut microbiota and liver transcriptome of silver carp after three-month in situ MPs exposure. (A) Correlation heatmap between differential gut phyla and liver gene modules (ME). (B) KEGG functional enrichment analysis based on key gene module MEdarkgreen. |
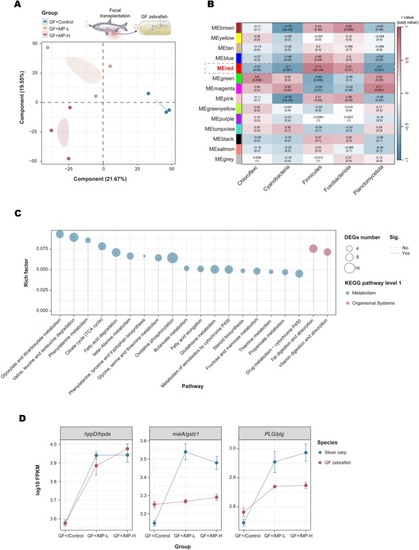
Transcriptome analysis of germ free (GF) zebrafish transplanted by gut microbiota of MPs-exposed silver carp. (A) PLS-DA of overall transcript profiles for three groups. (B) Correlation heatmap between differential gut phyla of silver carp and gene modules (ME) of GF zebrafish by WGCNA. (C) KEGG functional enrichment analysis based on key gene module MEred. (D) Expression levels of shared DEGs in the gene module MEdarkgreen of silver carp and MEred of GF zebrafish. |
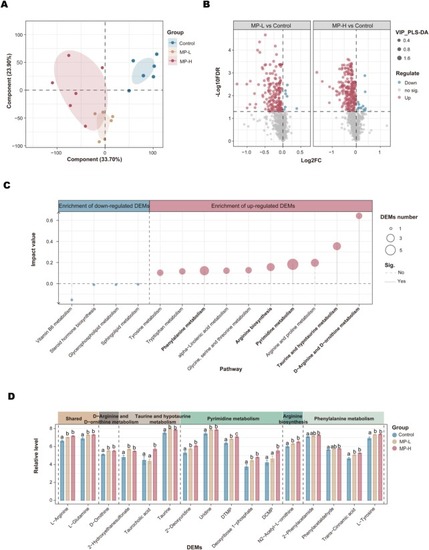
Liver metabolome analysis of silver carp after three-month in situ MPs exposure. (A) PLS-DA of overall metabolite profiles for three groups. (B) Volcano plot of DEMs between MPs-exposed groups and control. (C) KEGG topological analysis based on DEMs. (D) Expression levels of DEMs in the top five significant enrichment pathways obtained from Fig. 4C. Different lowercase letters indicate significant differences at p < 0.05. |
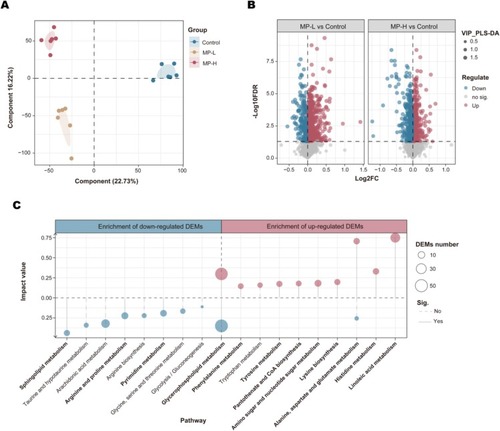
Muscle metabolome analysis of silver carp after three-month in situ MPs exposure. (A) PLS-DA of overall metabolite profiles for three groups. (B) Volcano plot of DEMs between MPs-exposed groups and control. (C) KEGG topological analysis based on DEMs. |

Multi-omics joint analysis of silver carp after three-month in situ MPs exposure. (A) The shared pathway enriched with DEGs and DEMs in liver. (B) Relevance network constructed from the correlation matrix to identify the association between liver DEMs and muscle DEMs. Based on the inferred correlation matrix, variables exceeding a correlation coefficient threshold of (r = 0.9) are considered highly associated. (C) A conceptual model of MPs interfering with the metabolism of silver carp through the gut-liver-muscle axis. |