
Image
|
Figure Caption
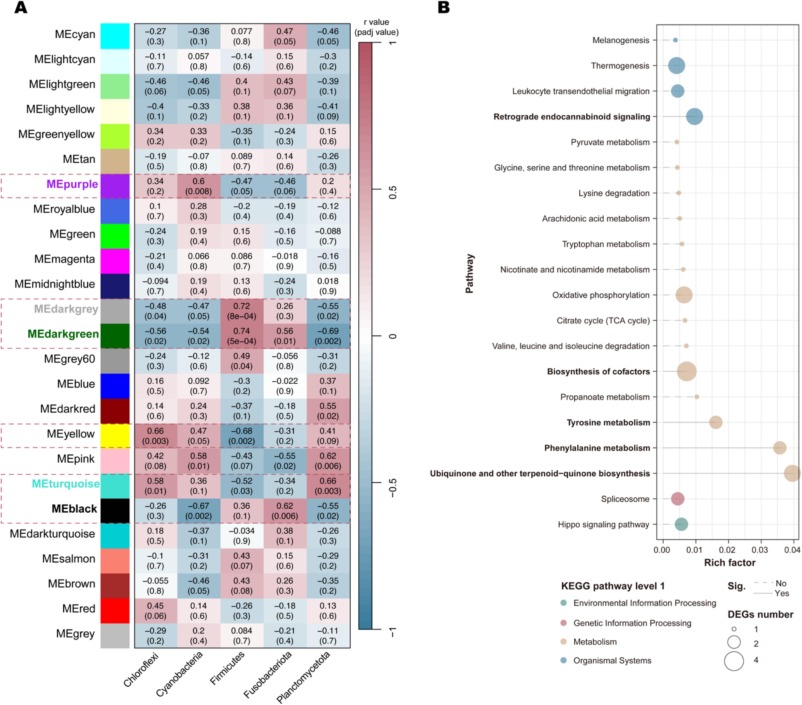
Fig. 3 WGCNA analysis between gut microbiota and liver transcriptome of silver carp after three-month in situ MPs exposure. (A) Correlation heatmap between differential gut phyla and liver gene modules (ME). (B) KEGG functional enrichment analysis based on key gene module MEdarkgreen.
Acknowledgments
This image is the copyrighted work of the attributed author or publisher, and
ZFIN has permission only to display this image to its users.
Additional permissions should be obtained from the applicable author or publisher of the image.
Full text @ Environ. Int.