
FIGURE
Fig. 2
- ID
- ZDB-FIG-250423-2
- Publication
- Huang et al., 2025 - Multi-omics association pattern between gut microbiota and host metabolism of a filter-feeding fish in situ exposed to microplastics
- Other Figures
- All Figure Page
- Back to All Figure Page
Fig. 2
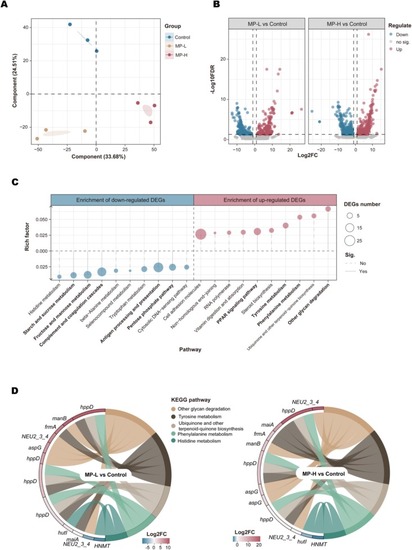
Liver transcriptome analysis of silver carp after three-month in situ MPs exposure. (A) PLS-DA of overall transcript profiles for three groups. (B) Volcano plot of DEGs between MPs-exposed groups and control. (C) KEGG functional enrichment analysis based on DEGs. (D) Expression levels of DEGs in the top five significant enrichment pathways obtained from Fig. 2C. |
Expression Data
Expression Detail
Antibody Labeling
Phenotype Data
Phenotype Detail
Acknowledgments
This image is the copyrighted work of the attributed author or publisher, and
ZFIN has permission only to display this image to its users.
Additional permissions should be obtained from the applicable author or publisher of the image.
Full text @ Environ. Int.