
Image
|
Figure Caption
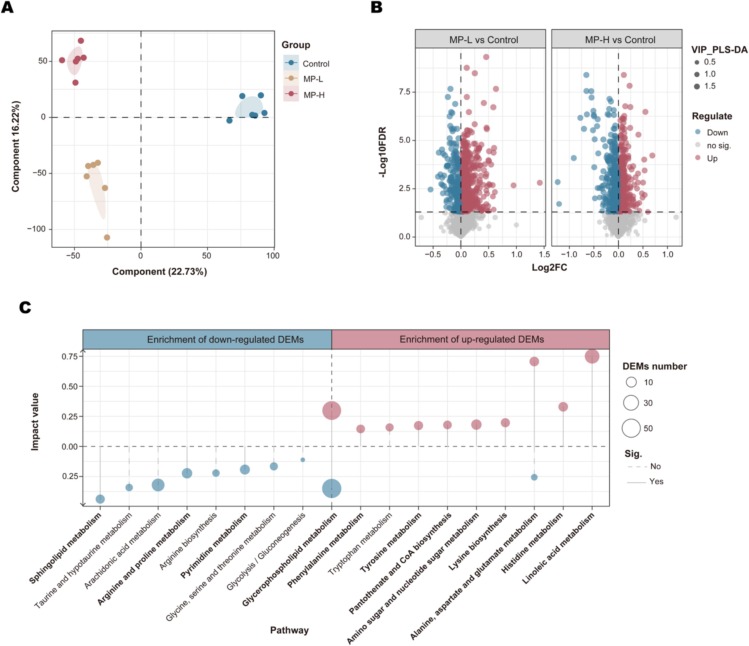
Fig. 6 Muscle metabolome analysis of silver carp after three-month in situ MPs exposure. (A) PLS-DA of overall metabolite profiles for three groups. (B) Volcano plot of DEMs between MPs-exposed groups and control. (C) KEGG topological analysis based on DEMs.
Acknowledgments
This image is the copyrighted work of the attributed author or publisher, and
ZFIN has permission only to display this image to its users.
Additional permissions should be obtained from the applicable author or publisher of the image.
Full text @ Environ. Int.