FIGURE SUMMARY
Title

Impacts of ribosomal RNA sequence variation on gene expression and phenotype

Authors
Welfer, G.A., Brady, R.A., Natchiar, S.K., Watson, Z.L., Rundlet, E.J., Alejo, J.L., Singh, A.P., Mishra, N.K., Altman, R.B., Blanchard, S.C.
Source
Full text @ Phil. Trans. Roy. Soc. Lond., Series B

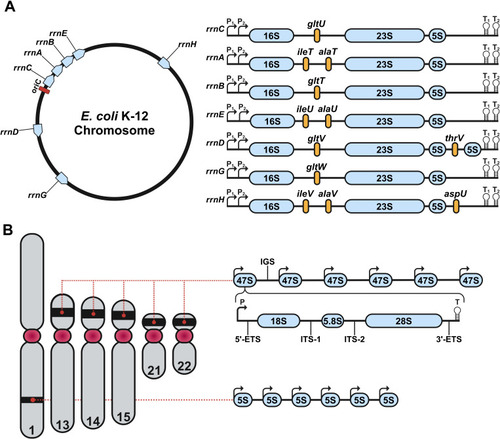
Genomic organization of rDNA in E. coli and human. (A) Chromosomal map of the seven rDNA operons (rrnC, rrnA, rrnB, rrnE, rrnD, rrnG and rrnH) in E. coli. On the left, each operon’s position is shown in blue relative to the origin of replication (oriC, red). On the right appear genetic structures of the seven rDNA operons. Each rDNA operon consists of the 16S, 23S and 5S rRNA genes. rrnD contains a second 5S gene, whereas all other operons only encode a single copy of each component. The rRNA genes are separated by internally transcribed regions, as well as unique tRNAs (yellow). Transcription initiation sites are marked by P₁ and P₂, termination sites for transcription are marked by T₁ and T₂. (B) Genomic organization of the rDNA operon in the human genome. Chromosome 1 encodes tandem repeats of 5S rRNA. Chromosomes 13, 14, 15, 21 and 22 encode tandem arrays of 47S rDNA operons within their p-arms. Each human rDNA operon contains a promoter (P), a 5’ externally transcribed region (5’-ETS), the 18S rRNA, internally transcribed region 1 (ITS-1), the 5.8S rRNA, internally transcribed region 2 (ITS-2), the 28S rRNA, the 3’ externally transcribed region (3’-ETS) and a transcriptional termination motif (T). Furthermore, each operon is separated by an intergenic spacing region (IGS). Created with BioRender.com.

Model of ribosome heterogeneity in E. coli. (A) Two distinct pathways for releasing stalled ribosomes during nutrient-limited stress. The first pathway is the stringent stress response, where ribosomes stalled on mRNA bind deacylated tRNA at the A site, thereby facilitating the association of RelA (Protein Data Bank (PDB): 5KPV). This interaction induces the production of (p)ppGpp, an alarmone that ultimately results in elevated transcription of rrnH carried out by RNA polymerase (PDB: 5MY1) and RpoS (PDB: 6UUC) complex within the cell. Consequently, the population of stress-response proteins is upregulated as a direct consequence of nutrient-limiting conditions. The alternative pathway is induced upon degradation of RelB in the RelB–RelE complex, which releases RelE (PDB: 4V7J) to bind at the A site of stalled ribosomes in the absence of aa-tRNA. RelE cleaves mRNA at the second nucleotide of the A site codon, leading to the association of small protein B (SmpB) and the tmRNA complex (PDB: 7AC7), which ultimately releases stalled ribosomes from the mRNA. (RNAP, RNA polymerase) (B) In the cartoon diagram, different colour patches indicate that the ribosomes are composed of different variants of 16S and 23S rRNAs. Model A illustrates mRNA translation by a heterogeneous population of ribosomes, each carrying different rRNA derived from various rDNA operons. Model B illustrates mRNA translation by a homogeneous population of ribosomes originating from a single rDNA operon. The shapes shown in the mRNA cartoons depict the PTrMs present in 5’ and 3’ untranslated regions (UTRs). (Key: LSU: large subunit, SSU: small subunit)

Variant ribosomes exhibit altered drug sensitivity. (A,B) BIOLOG phenotypic screening comparing the growth of Δ7prrn-BBB (red) and Δ7prrn-HBB (cyan) in the presence of (A) tetracycline and (B) oxytetracycline. Panels A and B are modified from Kurylo et al. [42]. (C) Schematic of tRNA selection measured using smFRET. FRET is monitored upon delivery of a ternary complex consisting of LD655-labelled Phe-tRNAPhe in complex with GTP bound elongation factor thermo-unstable (EF-Tu(GTP)) to surface-immobilized initiation complexes containing Cy3-labelled tRNAfMet in the P site. Incoming aa-tRNA enters the A site through a series of distinct intermediates; codon recognition (CR, FRET = 0.2), GTPase activation (GA, FRET = 0.5) and finally reaches the fully accommodated state (AC, FRET = 0.75). (D) Representative smFRET trace illustrating accommodation of incoming aa-tRNA into the A site through the intermediate steps of tRNA selection. (E,F) Post-synchronized population histograms of smFRET tRNA selection events on BBB and HBB ribosomes isolated from Δ7prrn-BBB and Δ7prrn-HBB respectively, in the presence of (E) tetracycline and (F) oxytetracycline. (G,H) Log odds of incoming Phe-tRNAPhe reaching the accommodated state in the presence of (G) tetracycline and (H) oxytetracycline. (I) PDB 7N1P was fitted into the head focused-refined cryo-EM maps of the BBB and HBB ribosomes, and the two maps were aligned based on the core of the head domain. The backbone root mean squared deviation (RMSD) between BBB and HBB ribosome structures was calculated in Chimera and the BBB ribosome cryo-EM unsharpened map is coloured according to their backbone deviations. Left and middle panels show two views encompassing the sequence variants, while the right hand panel shows the tetracycline binding site.

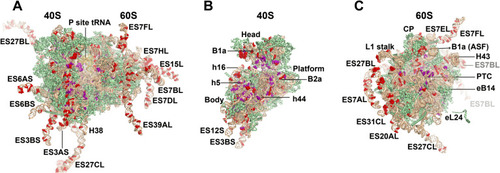
High-frequency rRNA variants detected in humans. (A) 80S human ribosome with modeled expansion segments labelled at high-frequency allelic variant positions (>20%). (B) 40S small subunit of human ribosome with high-frequency variant alleles. (C) 60S large subunit of human ribosome with variant high-frequency variant alleles. Key structural features of the ribosome are indicated. Key: rRNA, tan; RP, green; variant nucleotide, red; posttranscriptional modifications, purple. Model based on PDB: 8G5Y. Gray labels of expansion segments indicate their relative distance from the viewers perspective.

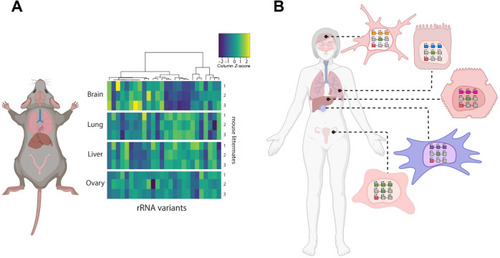
Tissue-specific expression of rRNA variants. (A) Experimentally observed variance in rRNA across different mouse tissues. This panel is reprinted from a previous publication [41] with the same caption: 'rRNA variant expression heat map and hierarchical clustering of the 26 variants detected to be differentially expressed among pairs of tissues. Each row represents a biological replicate. Rows are grouped by tissue source (three biological replicates, that is, rows, per tissue source). Each column represents an rRNA variant. Expression is normalized per rRNA variant (that is, by column) across all replicates and tissues (that is, 12 samples per each column). For example, the rRNA variant represented by the leftmost column has higher relative expression in brain, whereas the variant represented by the rightmost column has the lowest relative expression in liver.' (B) Model of tissue-specific rRNA variant expression in humans. Consistent with observations in mice, it is expected that humans also exhibit tissue-specific, and possibly even cancer-specific expression of rRNA variants from distinct loci (coloured squares in the nuclei of various tissues). Created with BioRender.com.

Acknowledgments
This image is the copyrighted work of the attributed author or publisher, and ZFIN has permission only to display this image to its users. Additional permissions should be obtained from the applicable author or publisher of the image. Full text @ Phil. Trans. Roy. Soc. Lond., Series B