IMAGE

Figure 5.

ID
ZDB-IMAGE-250307-23
Source
Figures for Welfer et al., 2025
Image
Figure Caption

Figure 5.

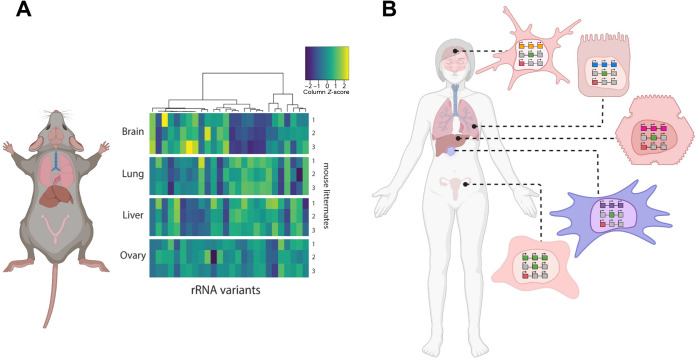
Tissue-specific expression of rRNA variants. (A) Experimentally observed variance in rRNA across different mouse tissues. This panel is reprinted from a previous publication [41] with the same caption: 'rRNA variant expression heat map and hierarchical clustering of the 26 variants detected to be differentially expressed among pairs of tissues. Each row represents a biological replicate. Rows are grouped by tissue source (three biological replicates, that is, rows, per tissue source). Each column represents an rRNA variant. Expression is normalized per rRNA variant (that is, by column) across all replicates and tissues (that is, 12 samples per each column). For example, the rRNA variant represented by the leftmost column has higher relative expression in brain, whereas the variant represented by the rightmost column has the lowest relative expression in liver.' (B) Model of tissue-specific rRNA variant expression in humans. Consistent with observations in mice, it is expected that humans also exhibit tissue-specific, and possibly even cancer-specific expression of rRNA variants from distinct loci (coloured squares in the nuclei of various tissues). Created with BioRender.com.

Acknowledgments
This image is the copyrighted work of the attributed author or publisher, and ZFIN has permission only to display this image to its users. Additional permissions should be obtained from the applicable author or publisher of the image. Full text @ Phil. Trans. Roy. Soc. Lond., Series B