
- Title
-
The novel role of foxi3 in zebrafish mandibular development
- Authors
- Chen, X., Yang, R., Zhang, T., Ma, J.
- Source
- Full text @ Cells Dev
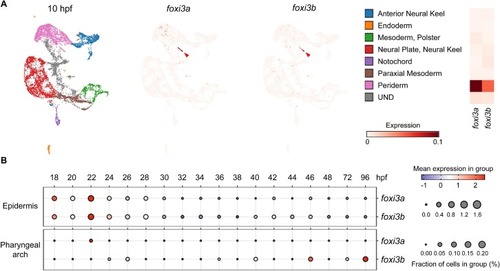
The expression of foxi3a and foxi3b in zebrafish. A. UMAP of single cells from zebrafish embryos at 10 hpf showing the expression of foxi3a and foxi3b in different cell subsets. The right heatmap indicating the average expression levels of foxi3a and foxi3b in each subcluster. Distinct cell populations are represented in various colors. Arrows indicate highly expressed cells. Red color depth reflects expression intensity. B. Dot plot illustrating the expression of foxi3a and foxi3b in the pharyngeal arch and epidermis clusters across various time points. The size of dots represents the fraction of cells expressing a particular marker, and color intensity indicates mean normalized scaled expression levels. UMAP, uniform manifold approximation and projection; hpf, hours postfertilization. |
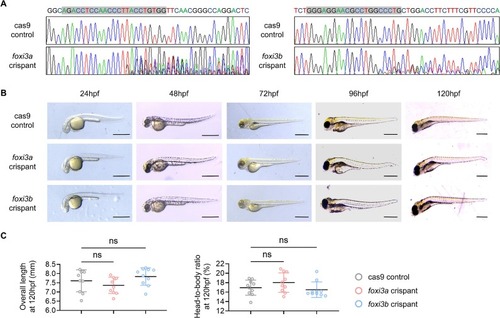
The overall development of foxi3a and foxi3b crispants appears normal. A. Validation of foxi3a and foxi3b knock-down. Guide RNAs successfully targeted foxi3a and foxi3b, causing frameshift mutation near the targeted sites (gray shadows). B. Lateral views of cas9 controls, foxi3a, and foxi3b crispants from 24 to 120 hours postfertilization (hpf). Scale bars, 1 mm. C. Quantification of overall length (left) and head-to-body ratio (right) at 120 hpf (n = 10 larvae per group; ns, no significant difference; one way ANOVA). All error bars indicate mean ± standard deviation. |
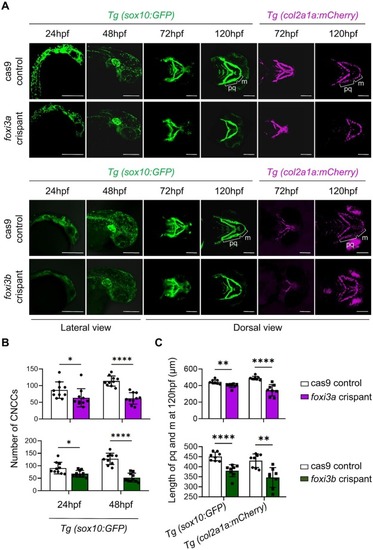
Disruption of foxi3a or foxi3b decreases cranial neural crest cell number and leads to the hypoplastic mandibular cartilage in zebrafish. A. Maximum projections of confocal live imaging Z stacks acquired from foxi3a and foxi3b Tg(sox10:GFP) and Tg(col2a1a:mCherry) zebrafish. Lateral views of foxi3a and foxi3b Tg(sox10:GFP) crispants show a significant reduction in CNCCs compared with controls at 24 and 48 hpf. Dorsal views of foxi3a and foxi3b Tg(sox10:GFP) and Tg(col2a1a:mCherry) crispants show hypoplastic mandibular cartilage at 72 and 120 hours postfertilization (hpf). Scale bars, 200 μm. B. Quantification of CNCCs at 24 and 48 hpf (n = 10 larvae per group for each time point; unpaired t-test). C. Quantification of the length of Meckel's cartilage (m) and palatoquadrate (pq) at 120 hpf (n = 8 larvae per group for each time point). All error bars indicate mean ± standard deviation. *p < 0.05, **p < 0.01, and ****p < 0.0001. |
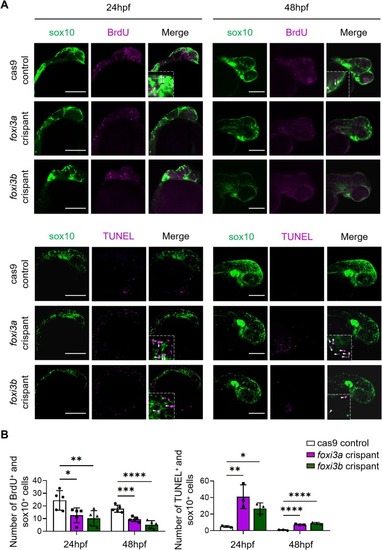
Cranial neural crest cells in foxi3a and foxi3b crispants display decreased proliferation and increased apoptosis. A. Confocal images of proliferating cells labeled with BrdU staining (magenta) and of apoptotic cells labeled with TUNEL staining (magenta) showing sox10 positive (green) CNCC proliferation decreases and apoptosis increases in foxi3a and foxi3b Tg(sox10:GFP) crispants at 24 hours postfertilization (hpf). Scale bars, 200 μm. B. Quantification of BrdU- and TUNEL-positive CNCCs in cas9 controls and foxi3a and foxi3b crispants at 24 hpf (n ≥ 3 larvae per group for each time point; *p < 0.05, **p < 0.01, ***p < 0.001, and ****p < 0.0001; one way ANOVA, Dunnett test). All error bars indicate mean ± standard deviation. |