
Fig. 1
- ID
- ZDB-FIG-250717-34
- Publication
- Chen et al., 2025 - The novel role of foxi3 in zebrafish mandibular development
- Other Figures
- All Figure Page
- Back to All Figure Page
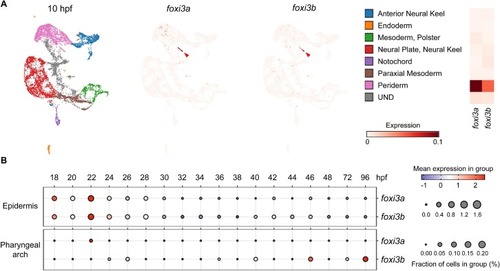
The expression of foxi3a and foxi3b in zebrafish. A. UMAP of single cells from zebrafish embryos at 10 hpf showing the expression of foxi3a and foxi3b in different cell subsets. The right heatmap indicating the average expression levels of foxi3a and foxi3b in each subcluster. Distinct cell populations are represented in various colors. Arrows indicate highly expressed cells. Red color depth reflects expression intensity. B. Dot plot illustrating the expression of foxi3a and foxi3b in the pharyngeal arch and epidermis clusters across various time points. The size of dots represents the fraction of cells expressing a particular marker, and color intensity indicates mean normalized scaled expression levels. UMAP, uniform manifold approximation and projection; hpf, hours postfertilization. |