
Fig. 3
- ID
- ZDB-FIG-250717-36
- Publication
- Chen et al., 2025 - The novel role of foxi3 in zebrafish mandibular development
- Other Figures
- All Figure Page
- Back to All Figure Page
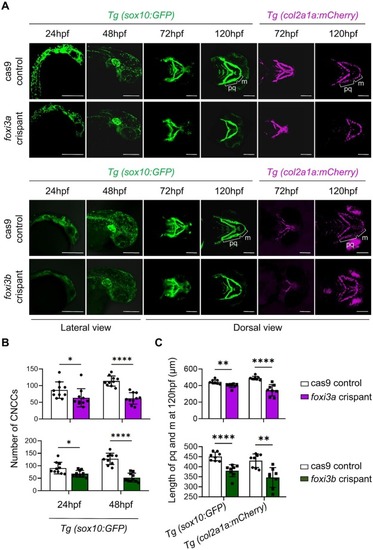
Disruption of foxi3a or foxi3b decreases cranial neural crest cell number and leads to the hypoplastic mandibular cartilage in zebrafish. A. Maximum projections of confocal live imaging Z stacks acquired from foxi3a and foxi3b Tg(sox10:GFP) and Tg(col2a1a:mCherry) zebrafish. Lateral views of foxi3a and foxi3b Tg(sox10:GFP) crispants show a significant reduction in CNCCs compared with controls at 24 and 48 hpf. Dorsal views of foxi3a and foxi3b Tg(sox10:GFP) and Tg(col2a1a:mCherry) crispants show hypoplastic mandibular cartilage at 72 and 120 hours postfertilization (hpf). Scale bars, 200 μm. B. Quantification of CNCCs at 24 and 48 hpf (n = 10 larvae per group for each time point; unpaired t-test). C. Quantification of the length of Meckel's cartilage (m) and palatoquadrate (pq) at 120 hpf (n = 8 larvae per group for each time point). All error bars indicate mean ± standard deviation. *p < 0.05, **p < 0.01, and ****p < 0.0001. |