
- Title
-
Activation of prep expression by Tet2 promotes the proliferation of bipotential progenitor cells during liver regeneration
- Authors
- Jia, K., Cheng, B., Huang, L., Xu, J., Liu, F., Liao, X., Liao, K., Lu, H.
- Source
- Full text @ Development

Expression of prep in regenerating livers. (A) Whole-mount in situ hybridization (WISH) images showing the expression of prep in the regenerating livers from the Tg (lfabp: GFP)+MTZ negative control group and Tg (lfabp: DenNTR)+MTZ group at BT, R0h, R8h, R24h and R48h; the arrow indicates the liver. (B) qPCR assay showing relative prep expression in the livers of the Tg (lfabp: DenNTR) and Tg (lfabp: DsRed) lines at BT, R0h, R8h, R24h and R48h. (C) Prep fluorescence in situ hybridization (FISH) and anti-2F11 staining images showing the regenerating livers at BT, R0h, R8h and R24h. **P<0.01, ***P<0.001 (two-tailed post hoc test). Data are mean±s.e.m. Scale bars: 100 μm (A); 75 µm (C, BT); 50 µm (C, 0h, R8h, R24h). |
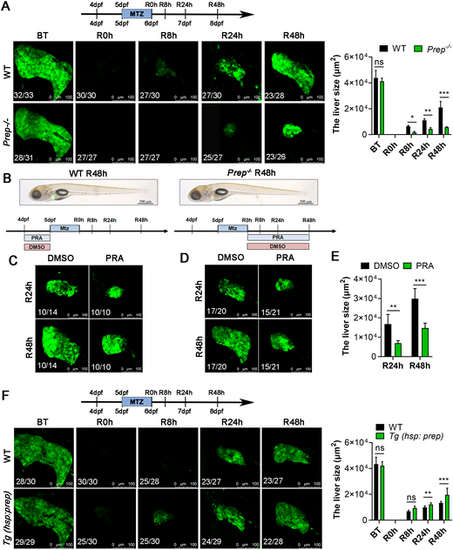
Prep is required for liver regeneration. (A) Confocal microscope projection images showing the size of the regenerating livers of WT siblings and Prep homozygous mutants (Prep−/−) at BT, R0h, R8h, R24h and R48h. Right panel: area of fluorescence statistics of Dendra2. (B) Brightfield and epifluorescence merged images showing the body phenotypes of WT siblings and Prep−/− at R48h. (C) Top panel: experimental scheme illustrating the pattern of the Prep inhibitor PRA added at 4 dpf and 5 dpf. Bottom panel: confocal microscope projection images showing the size of regenerating livers in the DMSO and PRA treatment groups at R24h and R48h. (D) Top panel: experimental scheme illustrating the pattern of the Prep inhibitor PRA added at R0h and R48h. Bottom panel: confocal microscope projection images showing the size of regenerating livers from the DMSO and PRA treatment groups at R24h and R48h. (E) Area of fluorescence statistics of Dendra2 for C and D. (F) Confocal microscope projection images showing the size of the regenerating livers of WT siblings and Tg (hsp701: Prep) at BT, R0h, R8h, R24h, and R48h. Right panel: area of fluorescence statistics of Dendra2. The observed green fluorescence is derived from the Denra2 fluorescent protein, specifically labeling the liver of zebrafish. Ns, not significant; *P<0.05, **P<0.01, ***P<0.001 (two-tailed post hoc test). Data are mean±s.e.m. Scale bars: 100 µm (A,C,D,F); 500 µm (B). |
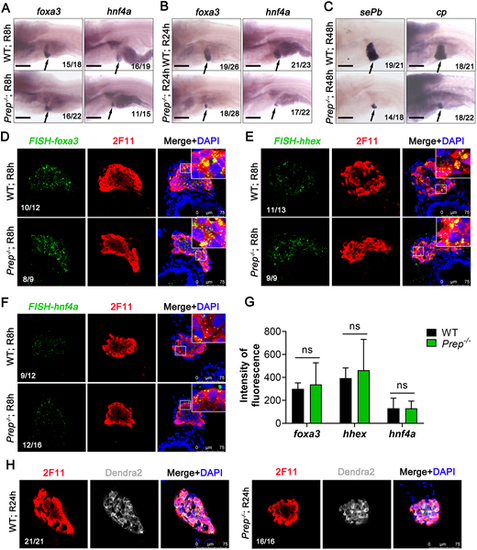
Prep does not block the de-differentiation and re-differentiation of bile duct epithelial cells. (A,B) WISH images showing the expression of foxa3 and hnf4a in WT siblings and Prep−/− at R8h (A) and R24h (B). The arrow indicates the liver. (C) WISH images showing the expression of sePb and cp in WT siblings and Prep−/− at R48h. The arrow indicates the liver. (D-F) Foxa3 (D), hhex (E) and hnf4a (F) FISH and anti-2F11 staining images showing the regenerating livers at R8h. (G) Fluorescence intensity statistics of Foxa3, hhex and hnf4a FISH in the liver region. ns, not significant (two-tailed post hoc test). Data are mean±s.e.m. (F) Single-section images of anti-2F11 and anti-Dendra2 antibody staining of the regenerated livers of WT siblings and Prep−/− at R24h. Scale bars: 100 μm (A-C); 75 µm (D-H). |

Prep regulates the proliferation of bipotential progenitor cells. (A) Single-section confocal microscope images showing anti-PCNA and anti-2F11 antibody staining of the regenerated livers of WT siblings and Prep−/− at BT, R0h, R8h, R24h and R48h. (B) Ratio of PCNA+ cells to 2F11+ cells in regenerated livers from A. The probability of PCNA+/2F11+ in regenerating livers was significantly reduced in Prep−/− compared with WT. (C) Single-section confocal microscope images showing anti-PCNA and anti-2F11 antibody staining of the regenerated livers from the DMSO and PRA treatment groups at BT, R0h, R8h, R24h and R48h. (D) Ratio of PCNA+ cells to 2F11+ cells in regenerated livers from C. (E) Single-section confocal microscope images showing anti-PCNA and anti-2F11 antibody staining of the regenerated livers of WT siblings and Tg (hsp701: Prep) at BT, R0h, R8h, R24h and R48h. (F) Ratio of PCNA+ cells to 2F11+ cells in regenerated livers from E. ns, not significant; *P<0.05, ***P<0.001 (two-tailed post hoc test). Data are mean±s.e.m. Scale bars: 75 µm. |
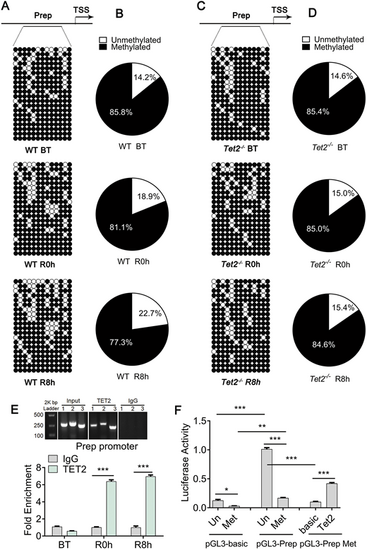
Tet2 activates prep expression. (A) Bisulfite sequencing analysis of DNA methylation at 13 independent CpG islands in the prep promoter locus in DNA isolated from WT regenerated livers at BT, R0h and R8h. Top panel: scheme illustrating the prep promoter region (−890 bp to −1390 bp) containing the 13 independent CpG island sites. TSS, transcription start site. Bottom panel: circle diagram showing the results of DNA methylation at 13 independent CpG islands in the prep promoter region. (B) Sector plots indicating the DNA methylation statistics of 13 independent CpG sites in the prep promoter region of WT regenerated livers at BT, R0h and R8h. The DNA demethylation of the prep promoter region was enhanced during liver regeneration. (C) Bisulfite sequencing analysis of DNA methylation at 13 independent CpG islands in the prep promoter locus in DNA isolated from Tet2 homozygous mutant (Tet2−/−) regenerated livers at BT, R0h and R8h. (D) Sector plots indicating the DNA methylation statistics of 13 independent CpG sites in the prep promoter of Tet2−/− regenerated livers at BT, R0h and R8h. The DNA demethylation of the prep promoter region was inhibited in Tet2−/− [open rings represent ‘unmethylated’ and filled rings represent ‘methylated’ in A and C, and the percentage statistics for unmethylated (white) and methylated (black) in B and D are from A and C]. (E) Top panel: anti-TET2 and anti-IgG antibody chromatin immunoprecipitation (ChIP) DNA electrophoresis showing a Prep promoter region DNA fragment size of approximately 250 bp. Bottom panel: ChIP-qPCR assays of anti-TET2 and anti-IgG antibody in DNA isolated from WT regenerated livers at BT, R0h and R8h. Results showed that the prep promoter was significantly increased in the anti-TET2 group compared with the anti-IgG control group. (F) Luciferase activity assay showed that the transcriptional activity of the unmethylated pGL3-Prep promoter was increased compared with the methylated pGL3-Prep promoter; adenovirus-transfected 293T cell overexpression of the TET2 protein enhanced transcriptional activity of the methylated pGL3-Prep promoter. *P<0.05, **P<0.01, ***P<0.001 (two-tailed post hoc test). Data are mean±s.e.m. |
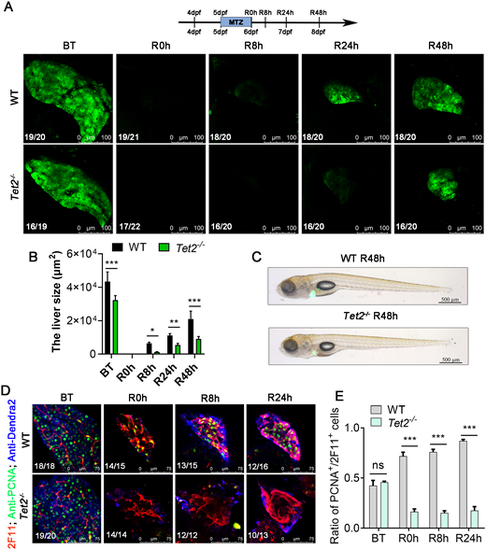
Tet2 mutant blocks liver regeneration. (A) Confocal microscope projection images showing the size of the regenerating livers of WT siblings and Tet2−/− at BT, R0h, R8h, R24h and R48h. The observed green fluorescence is derived from the Denra2 fluorescent protein, specifically labeling the liver of zebrafish. (B) Area of fluorescence statistics of Dendra2 for A. (C) Brightfield and epifluorescence merged images showing the body phenotypes of WT siblings and Tet2−/− at R48h. (D) Single-section confocal microscope images showing anti-PCNA and anti-2F11 antibody staining of the regenerated livers of WT siblings and Tet2−/− at BT, R0h, R8h, R24h and R48h. (E) Ratio of PCNA+ cells to 2F11+ cells in regenerated livers from C. ns, not significant; *P<0.05, **P<0.01, ***P<0.001 (two-tailed post hoc test). Data are mean±s.e.m. Scale bars: 100 µm (A); 500 µm (C); 75 µm (D). |
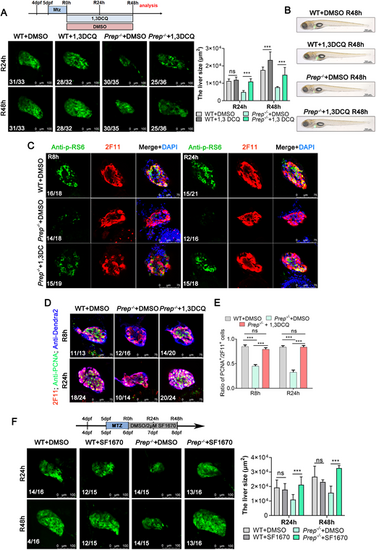
Prep activates the PI3K-Akt-mTOR signaling pathway. (A) Top panel: experimental scheme illustrating the pattern of DMSO and 1,3-DCQ added at R0h-R48h. Bottom panel: confocal microscope projection images showing the size of the regenerating livers from the WT+DMSO, WT+1,3-DCQ, Prep−/−+DMSO and Prep−/−+1,3-DCQ groups at R24h and R48h. The observed green fluorescence is derived from the Denra2 fluorescent protein, specifically labeling the liver of zebrafish. Right panel: Area of fluorescence statistics of Dendra2. (B) Brightfield and epifluorescence merged images showing the body phenotypes of the WT+DMSO, WT+1,3-DCQ, Prep−/−+DMSO and Prep−/−+1,3-DCQ groups at R48h. (C) Single-section confocal microscope images showing anti-p-RS6 and anti-2F11 antibody staining of the regenerated livers from the WT+DMSO, WT+1,3-DCQ, Prep−/−+DMSO and Prep−/−+1,3-DCQ groups at R8h and R24h. (D) Single-section confocal microscope images showing anti-2F11, anti-PCNA and anti-Dendra2 antibody staining of the regenerated livers from the WT+DMSO, WT+1,3-DCQ, Prep−/−+DMSO and Prep−/−+1,3-DCQ groups at R8h and R24h. (E) Ratio of PCNA+ cells to 2F11+ cells in regenerated livers from D. (F) Top panel: experimental scheme illustrating the pattern of DMSO and SF1670 added at R0h-R48h. Bottom panel: confocal microscope projection images showing the size of the regenerating livers from the WT+DMSO, WT+SF1670, Prep−/−+DMSO and Prep−/−+SF1670 groups at R24h and R48h. The observed green fluorescence is derived from the Denra2 fluorescent protein, specifically labeling the liver of zebrafish. Right panel: Area of fluorescence statistics of Dendra2. ns, not significant; ***P<0.001 (two-tailed post hoc test). Data are mean±s.e.m. Scale bars: 100 µm (A,F); 500 µm (B); 75 µm (C,D). |