SNHG4 was upregulated in glioma tissues and cell lines and ssociated with prognosis of patients. a The expression level of SNHG4 in multiple cancer tissues was analyzed by UALCAN website comparing to normal tissues, including glioma tissues. b The correlation between overall sruvival of glioma patients and high SNHG4 expression was analyzed by Kaplan–Meier plotter. c. The expression level of SNHG4 was measured by qRT-PCR in human glioma cell lines (Ln229, U251,U87) compared with the normal brain astrocyte cell line (SVG) (P = 0.0090 and 0.0099). **: P < 0.01

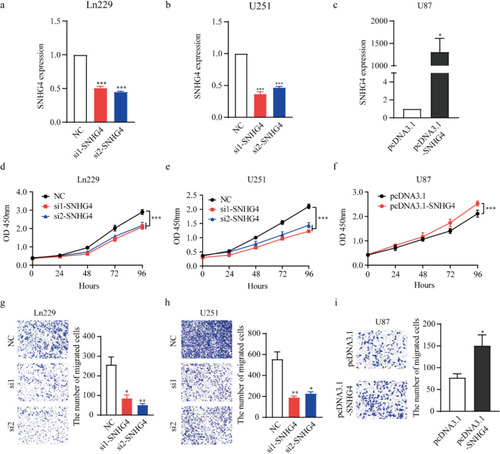
SNHG4 promoted the proliferation and migration of glioma cells in vitro. a The knockdown efficiency of SNHG4 was detected in Ln229 cells by qRT-PCR assay when transfection with si1-SNHG4, si2-SNHG4 and NC (P = 0.0027 and 0.0002). b The knockdown efficiency of SNHG4 was detected in U251 cells by qRT-PCR assay when transfection with si1-SNHG4, si2-SNHG4 and NC (P = 0.0030 and 0.0011). c. The overexpression efficiency of SNHG4 was detected in U87 cells by qRT-PCR assay when transfection with pcDNA3.1-SNHG4 plasmids (P = 0.0492). d, e CCK-8 assay were used to assess the proliferation of Ln229 (D) and U251 (E) cells after knocking-down SNHG4. f For overexpression of SNHG4 in U87 cells, the CCK-8 assay was used to assess the cell proliferation. g, h Transwell assays were performed to examine cell migration in Ln229 (g) and U251 (h) cells transfected with SNHG4 siRNAs (P = 0.0156 and 0.0064, P = 0.0067 and 0.0101). i. Transwell assays were performed to examine cell migration in U87 cells when transfection with pcDNA3.1-SNHG4 plasmids. *: P < 0.05, **: P < 0.01, ***: P < 0.001

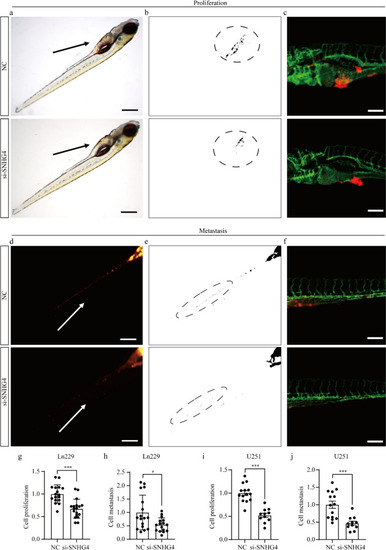
Knockdown of SNHG4 decreases the growth and metastasis of glioma cells in zebrafish xenograft. a The glioma cells transfected with si-SNHG4 or NC were injected into the PVS of 2-dpf (days post‑fertilization) wild type zebrafish larvae. Images of the yolk were taken by a stereomicroscope at 4 dpi. b The CM-DiI-positive areas in the yolk were quantified for cell proliferation. c The typical images were imaged by confocal microscope. d The glioma cells transfected with si-SNHG4 or NC were injected into the PVS of 2-dpf wild type zebrafish larvae. Images of the trunk were taken by a stereomicroscope at 4 dpi. e The CM-DiI-positive areas in the trunk were quantified for cell metastasis. f The typical images were imaged by confocal microscope. g, h Statistical analysis of proliferation (g) and metastasis (h) when knocking down SNHG4 in Ln229 cells (n = 17), compared with NC (n = 16) (P = 0.0001 and 0.0131). i, j Statistical analysis of proliferation (i) and metastasis (j) when knocking down SNHG4 in U251 cells (n = 14), compared with NC (n = 11) (P = 0.0002). *: P < 0.05, ***: P < 0.001. Scale: 100 μm

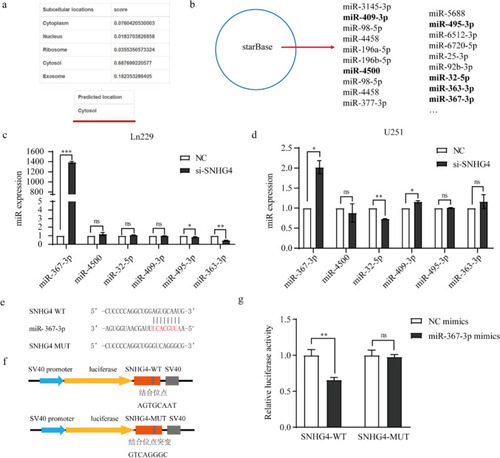
SNHG4 was a ceRNA to sponge miR-367-3p. a Subcellular localization of SNHG4 was analyzed by LncLocator website. b The potential miRNAs which might bind to SNHG4 by StarBase. c, d The expression levels of six miRNAs were examined when knockdown of SNHG4 in Ln229 (c) and U251 (d) cells by qRT-PCR (P < 0.0002 and 0.0249). e The potential binding site between miR-367-3p and SNHG4 was predicted by StarBase. f Schematic diagram of luciferase reporter plasmids construction, named pGL3-promoter-SNHG4-WT and pGL3-promoter-SNHG4-MUT. g Luciferase reporter assay was performed to assess the interaction between LINC01123 and miR-384 (P = 0.0031). *: P < 0.05, **: P < 0.01, ***: P < 0.01

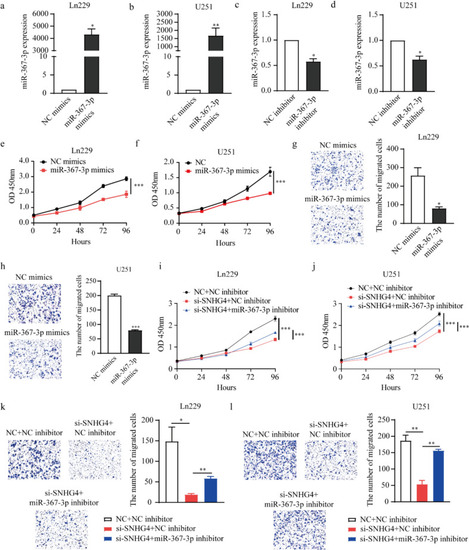
SNHG4 interacts with miR‐367-3p to regulate glioma cell proliferation and migration. a, b The overexpression efficiency of miR-367-3p in Ln229 (a) and U251 (b) cells when transfecting its mimics by qRT-PCR assay (P = 0.0106 and 0.0234). c, d The inhibitory efficiency of miR-367-3p in Ln229 (c) and U251 (d) cells when transfecting its inhibitor by qRT-PCR assay (P = 0.0163 and 0.0313). e, f The proliferation was assessed by CCK-8 assay when overexpression miR-367-3p in Ln229 (e) and U251 (f) cells. g, h The migration was assessed by Transwell assay when overexpression miR-367-3p in Ln229 (g) and U251 (h) cells (P = 0.0486). i, i. CCK-8 assay was used to evaluate cell proliferation and migration when co-transfection of miR-384 inhibitor and si-SNHG4 in Ln229 (i) and U251 (j) cells. k, l Transwell assays was used to evaluate cell migration when co-transfection of miR-384 inhibitor and si-SNHG4 in Ln229 (k) and U251 (l) cells (P = 0.0207 and 0.0022, 0.0029 and 0.0011). *: P < 0.05, **: P < 0.01, ***: P < 0.01

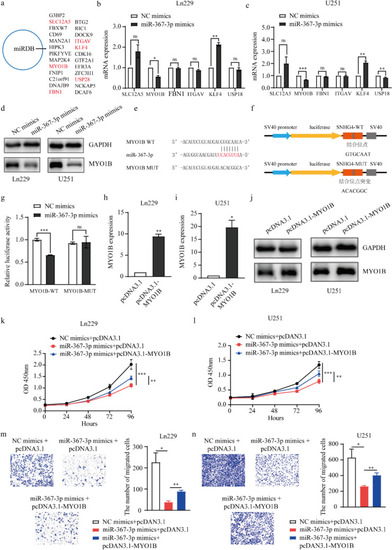
MYO1B is a target of miR-367-3p, and miR-367-3p regulates the progression of glioma through MYO1B. a The target genes of miR-367-3p was predicted by miRDB website. b, c The expression levels of target genes were detected in mRNA levels by qRT-PCR assay after overexpression of miR-367-3p in Ln229 (b) and U251 (c) cells (P = 0.0128 and 0.0062, 0.0002 and 0.0072). d The expression levels of MYO1B were detected in protein levels by western blot assay after overexpression of miR-367-3p in Ln229 and U251 cells. e The potential binding site between miR-367-3p and MYO1B 3’UTR was predicted by StarBase. f Schematic diagram of luciferase reporter plasmids construction, named pGL3-promoter-MYO1B-WT and pGL3-promoter-MYO1B-MUT. g Luciferase reporter assay was performed to assess the interaction between MYO1B 3’UTR and miR-367-3p (P = 0.0004). h, i The overexpression efficiency of MYO1B when transfection with pcDNA3.1- MYO1B plasmids in Ln229 (h) and U251 (i) cells at mRNA levels by qRT-PCR assays (P = 0.0039 and 0.0212). j. The overexpression efficiency of MYO1B when transfection with pcDNA3.1- MYO1B plasmids in Ln229 and U251 cells at protein level by western blot assays (P = 0.0039 and 0.0212). k, l CCK-8 assay was used to evaluate cell proliferation and migration when co-transfection of miR-367-3p mimics and pcDNA3.1- MYO1B in Ln229 (k) and U251 (l) cells. m, n Transwell assays were used to evaluate cell migration when co-transfection of miR-367-3p mimics and pcDNA3.1- MYO1B in Ln229 (m) and U251 (n) cells (P = 0.0495 and 0.0034). *: P < 0.05, **: P < 0.01, ***: P < 0.01

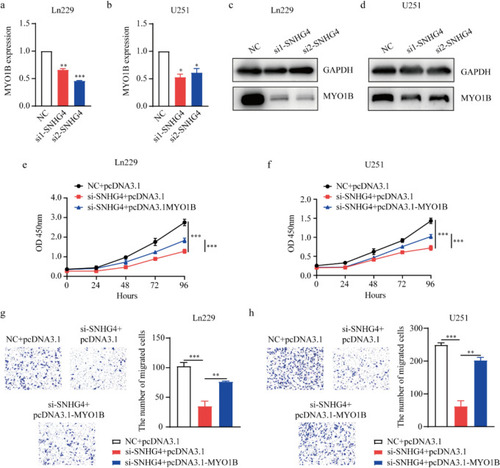
SNHG4 regulated the proliferation and migration of glioma cells via MYO1B. a, b The expression levels of MYO1B were examined after silencing SNHG4 in Ln229 (a) and U251 (b) cells at mRNA level by qRT-PCR assay (P = 0.0042 and 0.0001, 0.0126 and 0.0362). c, d The expression levels of MYO1B were examined after silencing SNHG4 in Ln229 (c) and U251 (d) cells at protein level by western blot assays. e, f CCK-8 assay was used to evaluate cell proliferation when co-transfection of si-SNHG4 and pcDNA3.1-MYO1B plasmid in Ln229 (e) and U251 (f) cells. g, h Transwell assay was used to evaluate cell migration when co-transfection of si-SNHG4 and pcDNA3.1-MYO1B plasmid in Ln229 (g) and U251 (h) cells (P = 0.0004 and 0.0012, 0.0004 and 0.0017). *: P < 0.05, **: P < 0.01, ***: P < 0.001

Acknowledgments
This image is the copyrighted work of the attributed author or publisher, and ZFIN has permission only to display this image to its users. Additional permissions should be obtained from the applicable author or publisher of the image. Full text @ Hum. Cell