
- Title
-
Evaluation of phenotypic and behavioural toxicity of micro- and nano-plastic polystyrene particles in larval zebrafish (Danio rerio)
- Authors
- Levesque, B., Hrapovic, S., Berrué, F., Vogt, A., Ellis, L.D., Hermabessiere, L.
- Source
- Full text @ Toxicol. Sci.
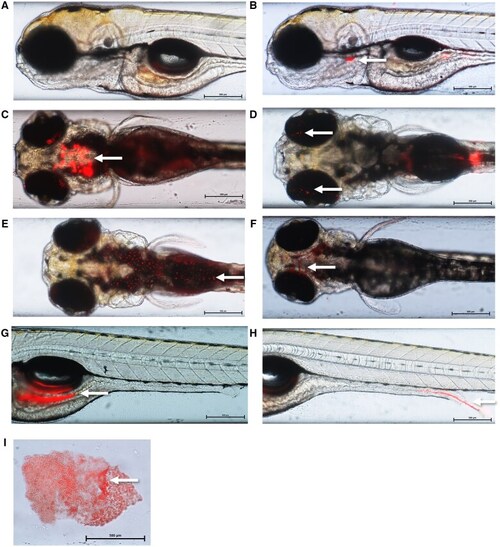
Representative images of Nile Red labeled PS micro- and nano-plastic particles in larval zebrafish demonstrating accumulation in the esophagus (B), mouth (C), eyes (D), dermal tissue (E), gills (F), gastrointestinal tract (G), hatched chorion (I), and excretion (H) as well as a control (A). White arrows point to the areas of plastic accumulation. Larvae were imaged at time points of 72 hpf (F, I), 96 hpf (A, B, C, E), and 120 (D, G, H) following ZET (B, C, F, G, I) or GBT (A, D, E, H) assays. Exposure concentrations were 0.02 (E), 0.05 (D), 0.1 (H), and 0.2 µg/µL (B, C, F, G, I). The above larvae were exposed to microplastic sizes of 0.25 µm (B, E, F, G, I), 0.53 µm (D, H), and 2.1 µm (C). Images are composed of a TRIT-C filter overlay on a brightfield image taken with a 4× objective and 2× magnification using a Nikon AZ100. |
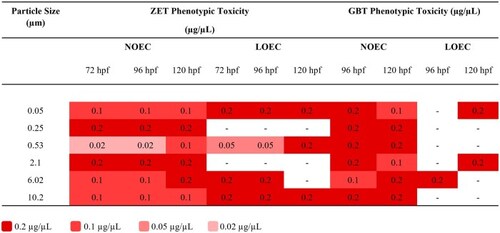
Summary of the NOEC and LOEC values at 120 hpf for phenotypic toxicity following ZET and GBT exposures of larvae to six different sizes of microplastic. |
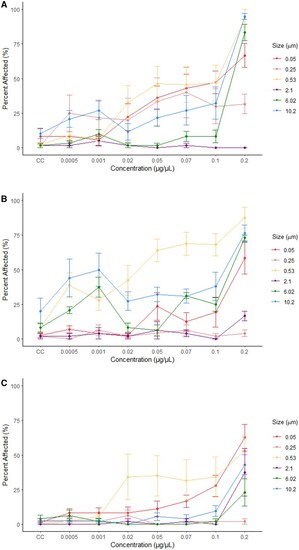
Mean percent and standard error of the mean of zebrafish larvae classified as affected following exposure to microplastics at seven exposure concentrations and a negative control (CC). Data are shown for larvae at 72 (A) ( |
Mean percent and standard error of the mean of zebrafish larvae classified as affected following exposure to microplastics at seven exposure concentrations and a negative control (CC). Data are shown for larvae at 96 (A) ( |
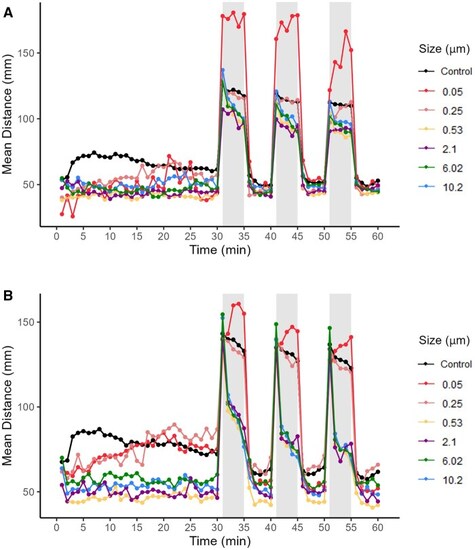
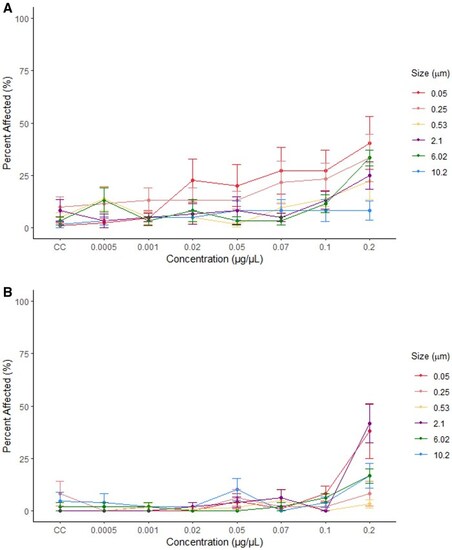
Mean distance traveled by larvae exposed to six different sizes of microplastic particles at a concentration of 0.2 µg/µL during a 60-min period following ZET (A) (Control |