
Image
|
Figure Caption
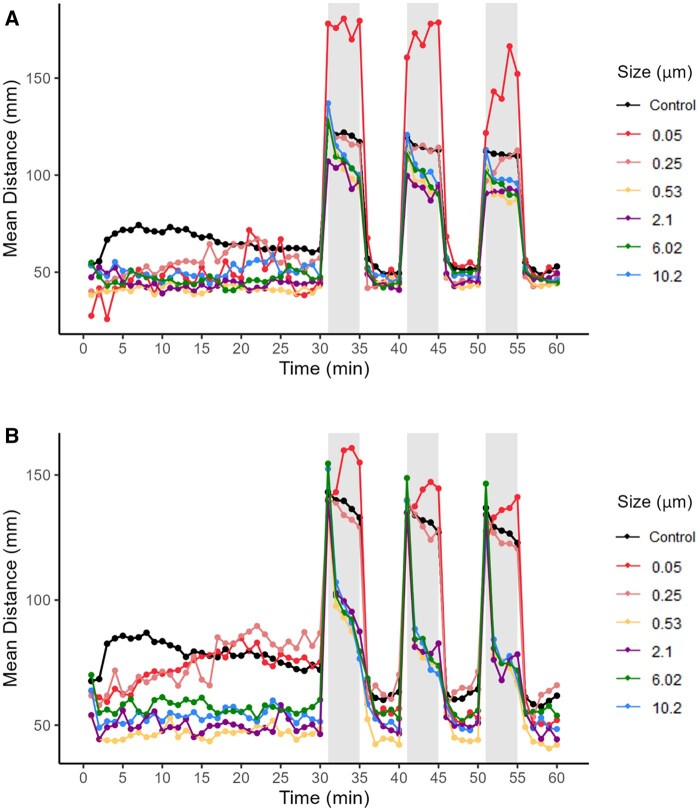
Fig. 5.
Mean distance traveled by larvae exposed to six different sizes of microplastic particles at a concentration of 0.2 µg/µL during a 60-min period following ZET (A) (Control
Acknowledgments
This image is the copyrighted work of the attributed author or publisher, and
ZFIN has permission only to display this image to its users.
Additional permissions should be obtained from the applicable author or publisher of the image.
Full text @ Toxicol. Sci.