
|
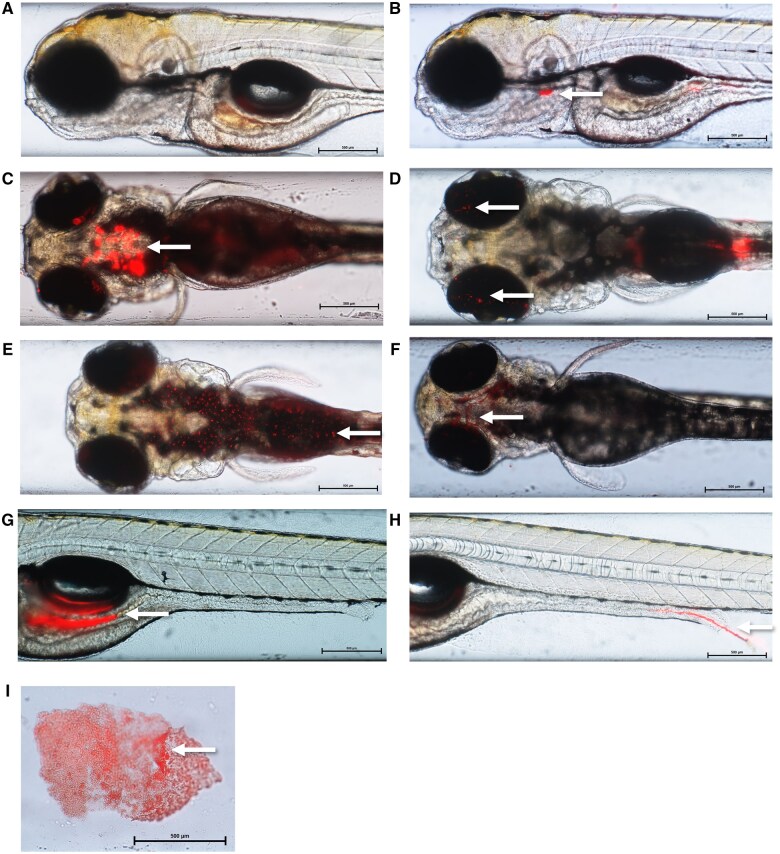
Fig. 1.
Representative images of Nile Red labeled PS micro- and nano-plastic particles in larval zebrafish demonstrating accumulation in the esophagus (B), mouth (C), eyes (D), dermal tissue (E), gills (F), gastrointestinal tract (G), hatched chorion (I), and excretion (H) as well as a control (A). White arrows point to the areas of plastic accumulation. Larvae were imaged at time points of 72 hpf (F, I), 96 hpf (A, B, C, E), and 120 (D, G, H) following ZET (B, C, F, G, I) or GBT (A, D, E, H) assays. Exposure concentrations were 0.02 (E), 0.05 (D), 0.1 (H), and 0.2 µg/µL (B, C, F, G, I). The above larvae were exposed to microplastic sizes of 0.25 µm (B, E, F, G, I), 0.53 µm (D, H), and 2.1 µm (C). Images are composed of a TRIT-C filter overlay on a brightfield image taken with a 4× objective and 2× magnification using a Nikon AZ100.