
Image
|
Figure Caption
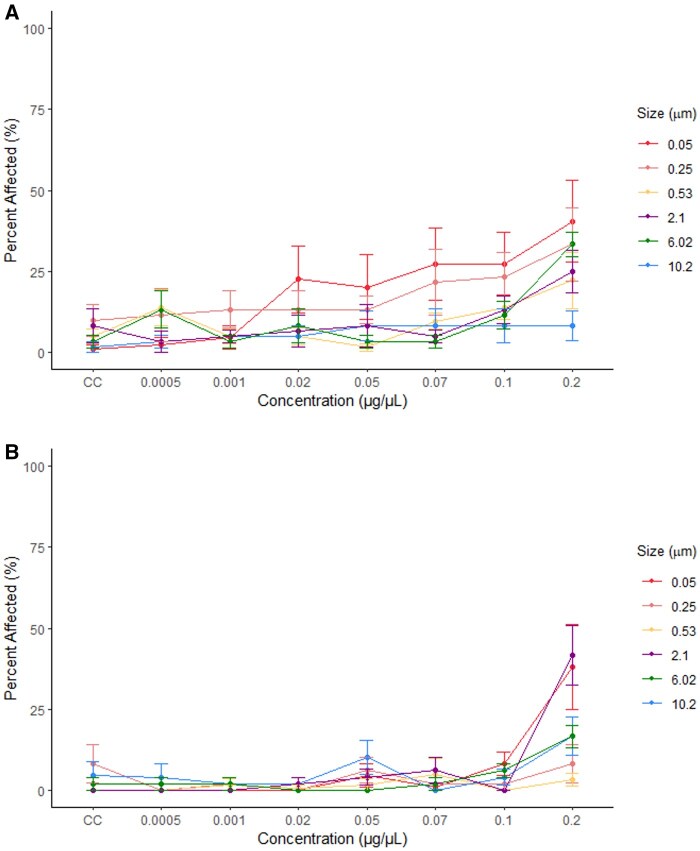
Fig. 4.
Mean percent and standard error of the mean of zebrafish larvae classified as affected following exposure to microplastics at seven exposure concentrations and a negative control (CC). Data are shown for larvae at 96 (A) (
Acknowledgments
This image is the copyrighted work of the attributed author or publisher, and
ZFIN has permission only to display this image to its users.
Additional permissions should be obtained from the applicable author or publisher of the image.
Full text @ Toxicol. Sci.