
- Title
-
Heterozygous pathogenic STT3A variation leads to dominant congenital glycosylation disorders and functional validation in zebrafish
- Authors
- Meng, L., Fang, Z., Jiang, L., Zheng, Y., Hong, S., Deng, Y., Xie, L.
- Source
- Full text @ Orphanet J Rare Dis

Clinical images of the proband. |
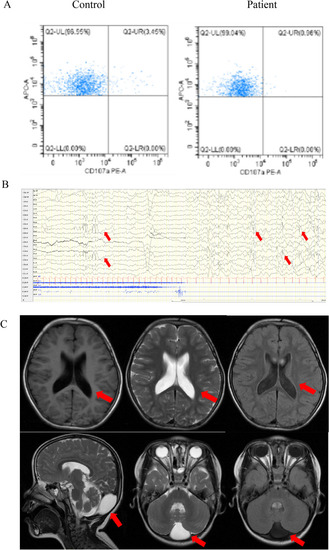
Auxiliary examination of the proband. |
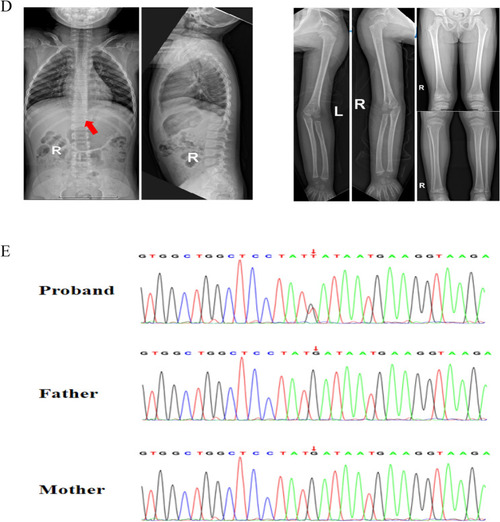
Auxiliary examination of the proband. |
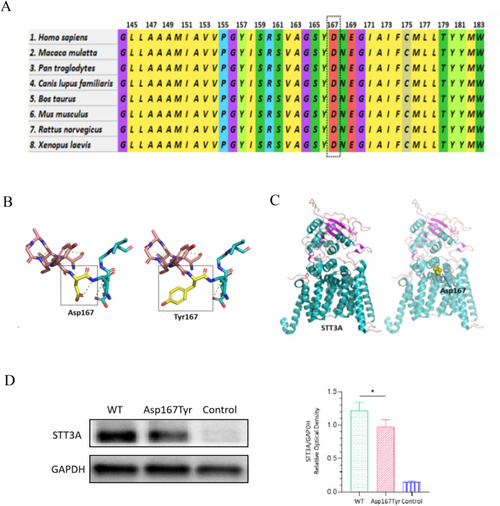
Characteristics of the variant and protein levels of STT3A. |
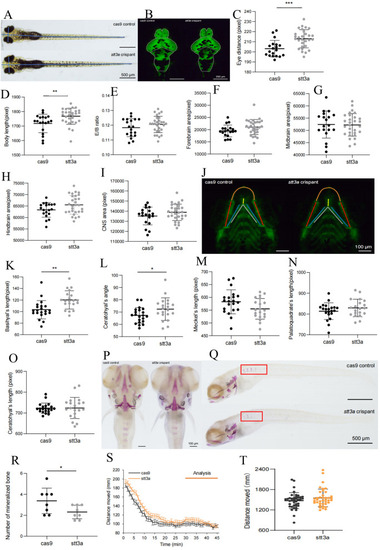
The phenotype validation of CRISPR-Cas9 established heterozygous knockdown zebrafish. |
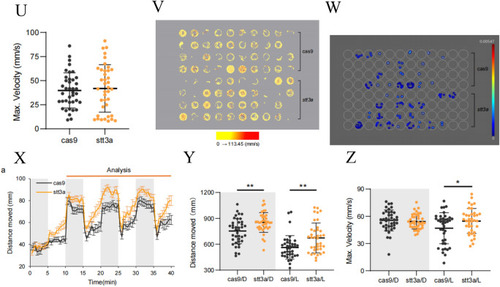
The phenotype validation of CRISPR-Cas9 established heterozygous knockdown zebrafish. |
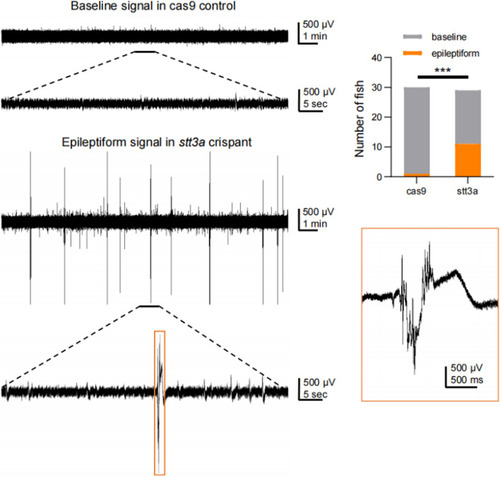
Representative electrophysiological signals of zebrafish in the Cas9 control group and the |