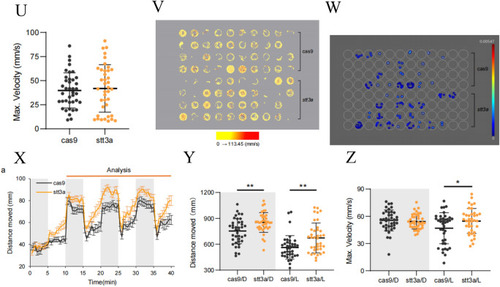
The phenotype validation of CRISPR-Cas9 established heterozygous knockdown zebrafish. A Bright-field images of the Cas9 control group and the stt3a crispant group zebrafish. B Fluorescence images of the brains of the zebrafish in the Cas9 control group and the stt3a crispant group. C, D Measurements of eye distance and body length in the Cas9 control group (n = 19 fish) vs. the stt3a crispant group (n = 29 fish; unpaired t test). E–I Measurements of the eye distance-to-body length ratio, forebrain area, midbrain area, hindbrain area, and total brain area in the Cas9 control group (n = 19 fish) vs. the stt3a crispant group (n = 29 fish; unpaired t test). J Representative fluorescence images of the lower jaw cartilage morphology of the zebrafish in the Cas9 control group and the stt3a crispant group. K–I Measurements of basal length and Ceratohyal angle in the Cas9 control group (n = 21 fish) vs. the stt3a crispant group (n = 20 fish; unpaired t test). M–O Measurements of Meckel’s length, Palatoquadrant’s length, and Ceratohyal’s length in the Cas9 control group (n = 21 fish) vs. the stt3a crispant group (n = 20 fish; unpaired t test). P–Q Representative images of zebrafish bone staining in the Cas9 control group and the stt3a crispant. Top view and side view. R Number of mineralized bones in the Cas9 control group (n = 8 fish) vs. the stt3a crispant group (n = 8 fish; unpaired t test). S Plot of the movement distance of the Cas9 control group (n = 39 fish) and stt3a crispant group (n = 39 fish) as a line graph with 1 min intervals; the error bars represent the standard error of the mean (SEM). T, U Measurements of movement distance and maximum speed in the Cas9 control group (n = 39 fish) vs. the stt3a crispant group (n = 39 fish; unpaired t test). V A 15 min trajectory plot where the color of the movement trajectory represents the speed, allowing observation that the Cas9 control group and stt3a crispant group exhibit similar trajectory densities and proportions of high-speed movement trajectories. (W) When ≥ 40 mm/s is used as the high-speed screening threshold to generate a 15 min heatmap of high-speed movement (with different colors representing frequency values), the proportions of individuals exhibiting high-speed movement and the frequency of high-speed movement occurrence are similar between the Cas9 control group and the stt3a crispant group. (X) Processing the movement distance data of the Cas9 control group (n = 39) and the stt3a crispant group (n = 38) into line graphs with 30 s intervals; the error bars represent the SEM. Y, Z L means light, D means dark. As the response of zebrafish larvae to changes in light and darkness was not significant in the first cycle, it was not included in the analysis. Data from cycles 2–4 were analyzed by averaging the three points corresponding to each time point in the three cycles. Measurements of movement distance and maximum speed in the Cas9 control group (n = 39 fish) vs. the stt3a crispant group (n = 38 fish; unpaired t test) under light and dark stimuli
|
