
- Title
-
Characterization of a chemically induced osteoarthritis model in zebrafish
- Authors
- Xiao, G., Qin, J., Yang, H., Song, Q., Zhang, R., Huang, J., Mou, Y., Liu, W., Sun, X., Nie, M.
- Source
- Full text @ Sci. Rep.
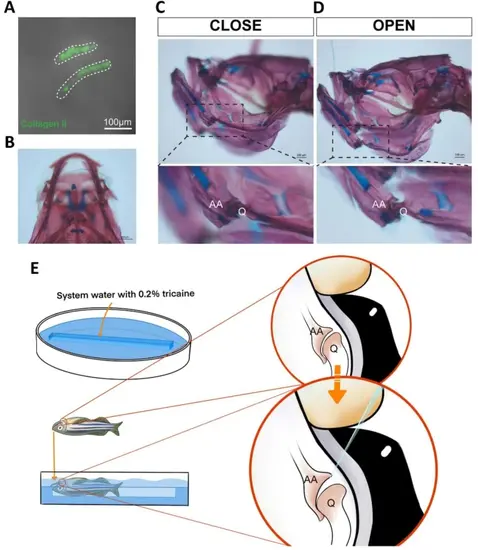
The zebrafish jaw joint was designated as a modelling joint. (A) Col2a1a: EGFP expression was widely observed on the surface cartilage of adult zebrafish jaw joint. (B–D) Alizarin red-Alcian blue staining of the whole skull of adult zebrafish and two states of the jaw joint were presented, including closed and opened. (E) Schematic diagram of zebrafish immobilization, in which zebrafish were immobilized in a supine position in an anesthetic-containing water, with the anterior end of the jaw placed in a groove at the top, and the jaw joint opened. |
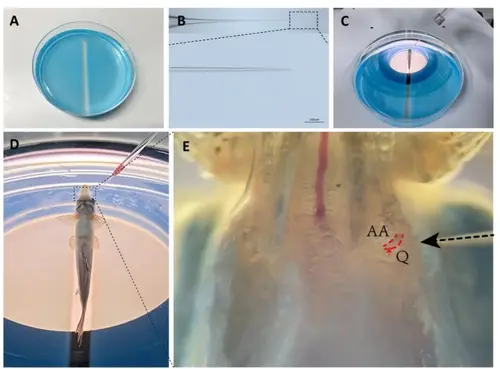
Development of a drug jaw joint injection model in zebrafish. (A) Fabrication of the immobilization mold using agarose gel. (B) Preparation of the glass capillary needle using a 15° slanted blade. (C) Zebrafish immobilization and angle adjustment. (D–E) Injection process, including exposing the jaw joint (red dashed lines), needle insertion (black dashed arrow), injection and needle retraction. AA, anguloarticular bone; Q, quadrate bone. |
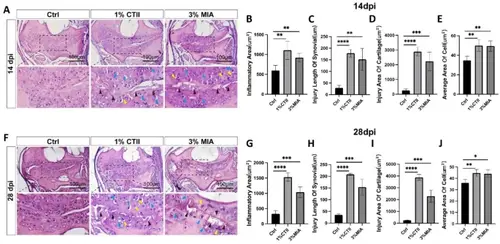
Morphological changes were observed in the cartilage of the jaw joint after administration of MIA and CTII. (A) HE staining of the jaw joint in the control group and drug-injected groups at 14 dpi. (B–E) Statistical analysis of inflammatory area, injury length of synovial, injury area of cartilage, and average area of cell between control and experimentao groups at 14 dpi. (F) HE staining of the jaw joint in the control group and drug-injected groups at 28 dpi. (G–J) Statistical analysis of inflammatory area, injury length of synovial, injury area of cartilage, and average area of cell between control and experimentao groups at 28 dpi. *P < 0.05, **P < 0.01, ***P < 0.001, ****P < 0.0001. All data were from n=5 zebrafish in each group. |
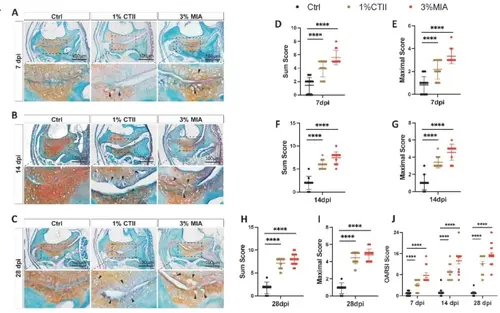
OARSI scoring for the mandibular joints of zebrafish. (A–C) Safranin O-Fast Green staining of the jaw joint in the control group and drug-injected groups at 7, 14 and 28 dpi. (D–E) Quantification of degenerative changes in joint cartilage at 7 dpi using the modified Zebrafish OARSI scoring method. (F–G) Quantification of degenerative changes in joint cartilage at 14 dpi. (H–I) Quantification of degenerative changes in joint cartilage at 28 dpi. (J) Statistical analysis of OARSI scores among 7, 14 and 28 dpi. ****P < 0.0001. All data were from n=5 zebrafish in each group. |
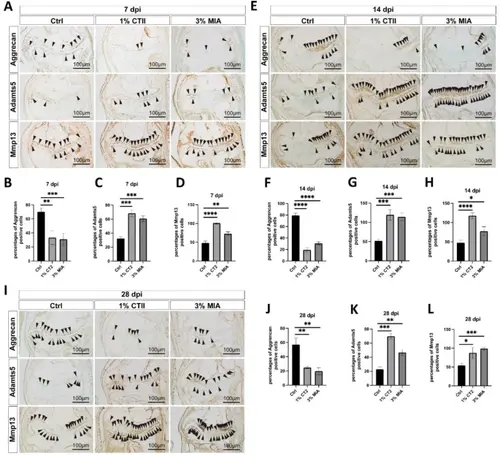
Aggrecan, Adamts5 and MMP13 expression in zebrafish OA model. (A–D) Immunohistochemical staining and relative quantitative analysis of Aggrecan, Adamts5 and MMP13 at 7 dpi. (E–H) Immunohistochemical staining and relative quantitative analysis of Aggrecan, Adamts5 and MMP13 at 14 dpi. (I–L) Immunohistochemical staining and relative quantitative analysis of Aggrecan, Adamts5 and MMP13 at 28 dpi. *P < 0.05, **P < 0.01, ***P < 0.001, ****P < 0.0001. All data were from n=5 zebrafish in each group.. |
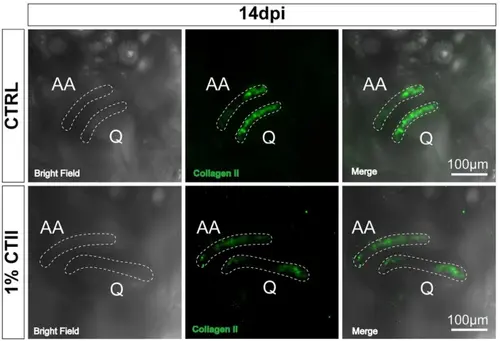
The expression of Collagen II in living zebrafish following the modeling process. At 14 dpi, there was a significant reduction of Collagen II expression on the surface of the jaw joint cartilage, indicating significant cartilage destruction. |