
|
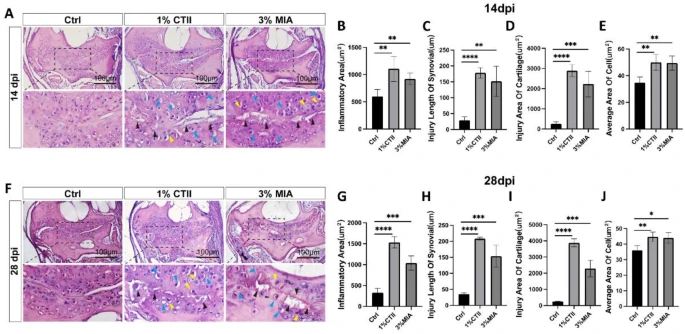
Fig. 3 Morphological changes were observed in the cartilage of the jaw joint after administration of MIA and CTII. (A) HE staining of the jaw joint in the control group and drug-injected groups at 14 dpi. (B–E) Statistical analysis of inflammatory area, injury length of synovial, injury area of cartilage, and average area of cell between control and experimentao groups at 14 dpi. (F) HE staining of the jaw joint in the control group and drug-injected groups at 28 dpi. (G–J) Statistical analysis of inflammatory area, injury length of synovial, injury area of cartilage, and average area of cell between control and experimentao groups at 28 dpi. *P < 0.05, **P < 0.01, ***P < 0.001, ****P < 0.0001. All data were from n=5 zebrafish in each group.