
Image
|
Figure Caption
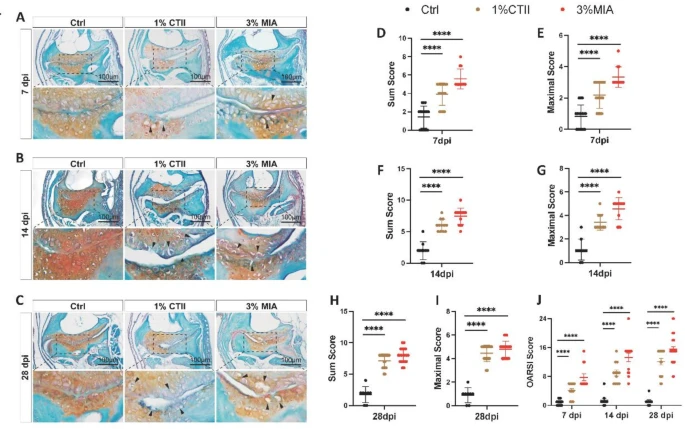
Fig. 4 OARSI scoring for the mandibular joints of zebrafish. (A–C) Safranin O-Fast Green staining of the jaw joint in the control group and drug-injected groups at 7, 14 and 28 dpi. (D–E) Quantification of degenerative changes in joint cartilage at 7 dpi using the modified Zebrafish OARSI scoring method. (F–G) Quantification of degenerative changes in joint cartilage at 14 dpi. (H–I) Quantification of degenerative changes in joint cartilage at 28 dpi. (J) Statistical analysis of OARSI scores among 7, 14 and 28 dpi. ****P < 0.0001. All data were from n=5 zebrafish in each group.
Acknowledgments
This image is the copyrighted work of the attributed author or publisher, and
ZFIN has permission only to display this image to its users.
Additional permissions should be obtained from the applicable author or publisher of the image.
Full text @ Sci. Rep.