
Image
|
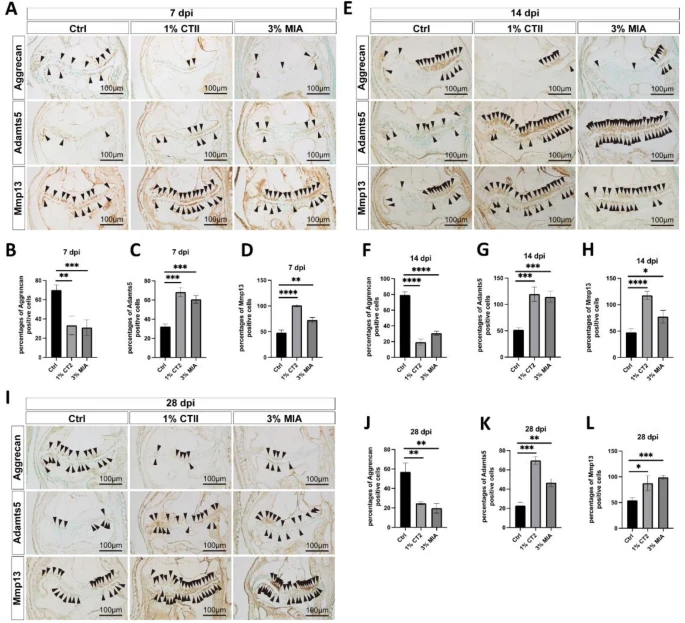
Figure Caption
Fig. 5 Aggrecan, Adamts5 and MMP13 expression in zebrafish OA model. (A–D) Immunohistochemical staining and relative quantitative analysis of Aggrecan, Adamts5 and MMP13 at 7 dpi. (E–H) Immunohistochemical staining and relative quantitative analysis of Aggrecan, Adamts5 and MMP13 at 14 dpi. (I–L) Immunohistochemical staining and relative quantitative analysis of Aggrecan, Adamts5 and MMP13 at 28 dpi. *P < 0.05, **P < 0.01, ***P < 0.001, ****P < 0.0001. All data were from n=5 zebrafish in each group..
Acknowledgments
This image is the copyrighted work of the attributed author or publisher, and
ZFIN has permission only to display this image to its users.
Additional permissions should be obtained from the applicable author or publisher of the image.
Full text @ Sci. Rep.