High glucose treatment induced the aggregation of vascular endothelial cell (EC) nuclei in the intersegmental vessels (ISVs) of zebrafish embryos. A and B, Schematic diagram showing the high glucose treatment timeline and confocal imaging region. C through G, Confocal imaging analysis of control (Ctrl) and high glucose–treated Tg(fli1a:nGFP::kdrl:ras-mCherry) embryos at 72 hours post-fertilization (hpf). C′ through G′, The magnifications of the red dotted boxes in C through G, respectively. The arrowheads indicate the EC nuclei in the ISV. I, The distance from the EC nuclei to the midline (DNTM) in ISVs in Ctrl and high glucose–treated embryos. J, The proportion of EC nuclei in ISVs in the 4 zones is shown in E and H. K, Statistics of the nearest neighbor distance (NND) of EC nuclei in Ctrl embryos (n=16) and high glucose–treated embryos (n=19). t test. L and M, Statistics of the range and SD of DNTM in Ctrl embryos (n=15) and high glucose–treated embryos (n=18). t test. Scale bars, 100 µm.

The aggregation of endothelial cell (EC) nuclei in zebrafish embryos was induced by high glucose treatment at different time windows. A through D, Schematic diagrams of different time windows of high glucose treatment and confocal images. The right panels are the magnifications of the white dotted boxes. A′ through D′, Statistics of the EC nuclei nearest neighbor distance (NND) in different time windows in A through D, respectively. n=9 control (Ctrl; A′) and n=8 high glucose (A′), n=10 Ctrl (B′) and n=8 high glucose (B′), n=10 Ctrl (C′) and n=8 high glucose (C′), n=10 Ctrl (D′) and n=9 high glucose (D′). t test. Scale bars, 100 µm.

High glucose treatment caused excessive migration of vascular endothelial cell (EC) nuclei in intersegmental vessels (ISVs) of zebrafish embryos. A through N, Still images from in vivo time-lapse imaging analysis of Tg(fli1a:nGFP::kdrl:ras-mCherry) embryos from 63 to 75 hours post-fertilization (hpf). A′ through N′, The nGFP channel of the above panels, respectively. The numbers represent different EC nuclei in unilateral ISVs. O and P, Diagrams of the migration routes of EC nuclei labeled in A′ through N′. Q, Statistics of the distance of EC nuclei migration at different time stages in control (Ctrl) embryos (n=8) and high glucose–treated embryos (n=8). Two-way ANOVA. R, The number of EC nuclei in different migration distances of Ctrl embryos and high glucose–treated embryos. Scale bars, 50 µm.

Foxo1 (forkhead box protein O1) deficiency promoted human retinal microvascular endothelial cell (HRMEC) migration and resulted in the aggregation of endothelial cell (EC) nuclei in zebrafish embryos. A, Schematic diagram of drug treatment time window and confocal imaging region. B, Confocal imaging analysis of control (Ctrl), high glucose–treated, and AS1842856-treated Tg(fli1a:nGFP::kdrl:ras-mCherry) embryos at 72 hours post-fertilization (hpf). C, Statistics of the EC nuclei nearest neighbor distance (NND) in Ctrl (n=22), high glucose–treated (n=32), and AS1842856-treated embryos (n=26). t test. D, Confocal imaging analysis of EC nuclei in ISVs in the Ctrl embryos, high glucose–treated embryos, and Tg(hsp70l:foxo1a-6×His-P2A-mCherry) and high glucose–treated embryos at 72 hpf. E, Statistical analysis of the EC nuclei NND in the Ctrl embryos (n=22), high glucose–treated embryos (n=32), and Tg(hsp70l:foxo1a-6×His-P2A-mCherry) and high glucose–treated embryos (n=26) at 72 hpf. One-way ANOVA. F through H′, The results of the wound-healing assay showed that high glucose and AS1842856 treatment promotes HRMEC migration, in comparison with the dimethyl sulfoxide (DMSO)–treated group. I, Real-time PCR analysis of FOXO1 expression in HRMECs treated with DMSO and high glucose. Each dot represents data from an independent experiment (n=3). t test. J, Statistical analysis of the wound-healing percentage in the DMSO, high glucose–treated, and AS1842856-treated groups. Each dot represents data from an independent experiment (n=6). t test. Scale bars, 100 µm. nGFP indicates green fluorescent protein for nuclei.

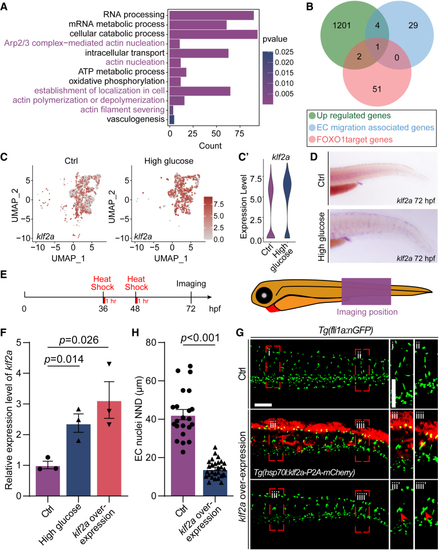
Klf2a (Krüppel-like transcription factor 2a) was involved in the nuclei aggregation induced by high glucose treatment. A, GO analysis of 1201 upregulated genes in arterial and capillary endothelial cells (ECs). B, Venn diagram showing the overlap between FOXO1 (forkhead box protein O1) target genes, EC migration–associated genes, and significantly upregulated genes. C, The feature plot of klf2a of control (Ctrl) and high glucose group in arterial and capillary ECs. C′, The violin plot of klf2a of Ctrl and high glucose group in arterial and capillary ECs. D, Whole-mount in situ hybridization analysis of klf2a in Ctrl and high glucose–treated embryos. E, Schematic diagram of heat shock treatment and confocal imaging region. F, Real-time PCR analysis of klf2a expression in Ctrl, high glucose–treated, and klf2a overexpressed embryos. Each dot represents data from an independent experiment (n=3). t test. G, Confocal imaging analysis of Ctrl embryos and Tg(hsp70l:klf2a-P2A-mCherry) embryos at 72 hours post-fertilization (hpf). The right panels (i, ii, iii, iiii, iii', iiii') are the magnifications of the red dotted boxes. Arrowheads indicate the EC nuclei. H, Statistics of the EC nuclei nearest neighbor distance (NND) in Ctrl (n=22) and Tg(hsp70l:klf2a-P2A-mCherry) embryos (n=28). t test. Scale bars, 100 µm. Arp2/3 indicates actin-related proteins-2/3; GO, gene ontology; PCR, polymerase chain reaction; and UMAP, uniform manifold approximation and projection.

High glucose treatment induced nuclei aggregation through foxo1a-klf2a signal in zebrafish embryos. A, Real-time PCR analysis of klf2a expression in control (Ctrl) and AS1842856-treated embryos. Each dot represents data from an independent experiment (n=3). t test. B, Real-time PCR analysis of KLF2 expression in human umbilical vein endothelial cells (ECs) treated with dimethyl sulfoxide (DMSO) and AS1842856. Each dot represents data from an independent experiment (n=3). t test. C, A potential Foxo1 (forkhead box protein O1)-binding sequence presented in JASPAR database. D, Three Foxo1a different candidate binding sites (BSs) upstream of the transcription start site of klf2a in zebrafish. E, Results of the chromatin immunoprecipitation–PCR assay demonstrated that the predicted sequence ATGTAAACATT is a Foxo1a BS of klf2a in zebrafish. Schematic diagram showing the Foxo1a BS in the klf2a promoter region. Input sonicated genomic DNA samples without immunoprecipitation as a positive control. IgG, sonicated, and IgG-immunoprecipitated genomic DNA samples as a negative control. F and G, Luciferase reporter activity in foxo1a overexpressed or knocked down embryos, respectively. Each dot represents data from an independent experiment (n=3). t test. H, Confocal imaging analysis of Ctrl embryos, high glucose–treated embryos, and Tg(hsp70l:mApple-klf2a-DN) and high glucose–treated embryos at 72 hours post-fertilization (hpf). I, Statistical analysis of the EC nuclei nearest neighbor distance (NND) in the Ctrl (n=22), high glucose–treated (n=32), and Tg(hsp70l:mApple-klf2a-DN) and high glucose–treated embryos (n=24) at 72 hpf. One-way ANOVA. Scale bars, 100 µm. DN indicates dominant negative; and PCR, polymerase chain reaction.

Working model of high glucose treatment induced endothelial cell (EC) nuclei aggregation in intersegmental vessels of zebrafish embryos. A indicates dorsal aorta; aISV, arterial intersegmental vessel; EC, endothelial cell; Foxo1a, forkhead box protein O1a; klf2a, Krüppel-like factor 2a; PCV, posterior cardinal vein; and vISV, venous intersegmental vessel.

Acknowledgments
This image is the copyrighted work of the attributed author or publisher, and ZFIN has permission only to display this image to its users. Additional permissions should be obtained from the applicable author or publisher of the image. Full text @ Arterio., Thromb., and Vas. Bio.