|
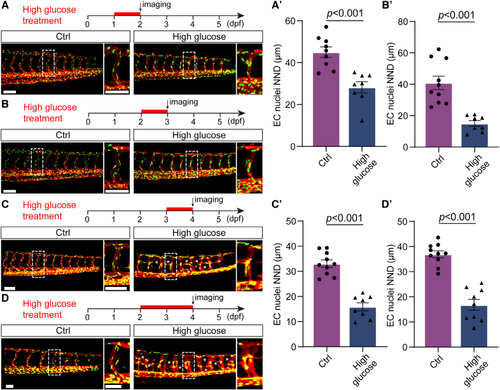
The aggregation of endothelial cell (EC) nuclei in zebrafish embryos was induced by high glucose treatment at different time windows. A through D, Schematic diagrams of different time windows of high glucose treatment and confocal images. The right panels are the magnifications of the white dotted boxes. A′ through D′, Statistics of the EC nuclei nearest neighbor distance (NND) in different time windows in A through D, respectively. n=9 control (Ctrl; A′) and n=8 high glucose (A′), n=10 Ctrl (B′) and n=8 high glucose (B′), n=10 Ctrl (C′) and n=8 high glucose (C′), n=10 Ctrl (D′) and n=9 high glucose (D′). t test. Scale bars, 100 µm.
|