
- Title
-
Maternal exposure to tris (2-butoxyethyl) phosphate induces F0 female reproductive toxicity and offspring developmental toxicity in zebrafish
- Authors
- Dong, A., Lei, W., Zhou, W., Li, W., Wang, J.
- Source
- Full text @ Ecotoxicol. Environ. Saf.
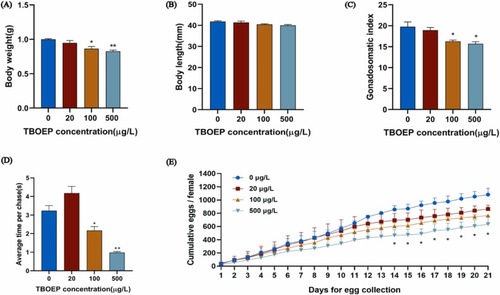
Impact on body weight (A), body length (B), gonadosomatic index (GSI) (C) (n = 30), the mean duration of interaction between fish of two sexes in 10 minutes (D) (n = 9) and cumulative eggs (E) (n = 30). The findings are displayed as mean ± SEM. *p < 0.05 and * *p < 0.01 signify notable disparities between the test and control groups. |
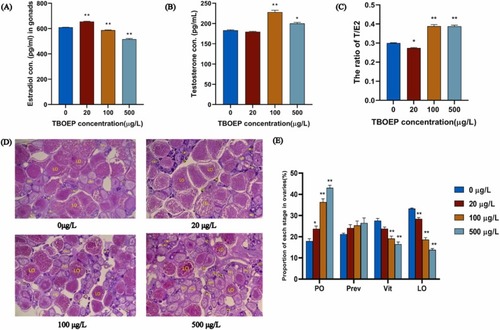
Impact on serum E2 (A), T levels (B), the ratio of T/E2 (C), representative images of gonad sections from female zebrafish (D) and the ratio of different phases in gonads of female zebrafish (E) following exposure to 0, 20, 100, 500 µg/L TBOEP. The findings are displayed as mean ± SEM. (n = 6). *p < 0.05 and * *p < 0.01 signify notable disparities between the test and control groups. |
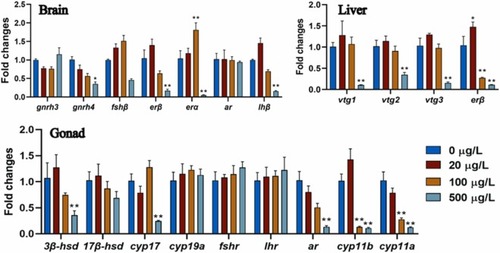
Analyzing gene expression patterns in chosen endocrine routes along the HPGL axis. The findings are displayed as mean ± SEM. (n = 6). The difference between the test and control groups is denoted by *p < 0.05, * *p < 0.01. |
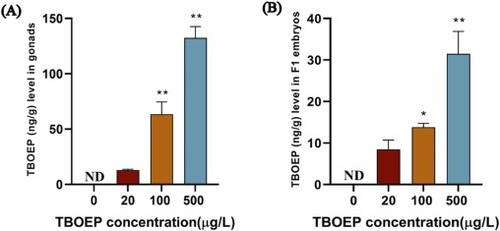
Concentrations of TBOEP in gonads of zebrafish subjected to 0, 20, 100, and 500 µg/L TBOEP (A), concentrations of TBOEP in F1 embryos (B). The findings are displayed as mean ± SEM. (n = 3). The difference between the test and control groups is denoted by *p < 0.05, * *p < 0.01. ND: not detected. |
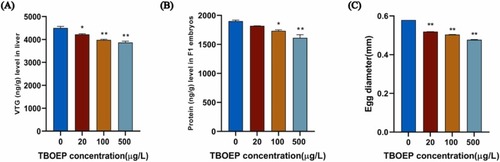
The content of vitellogenin in F0 female zebrafish livers (A), the protein content of offspring embryos of female zebrafish (B) and egg diameter (C). The findings are displayed as mean ± SEM. (n = 3). The difference between the test and control groups is denoted by *p < 0.05, * *p < 0.01. |
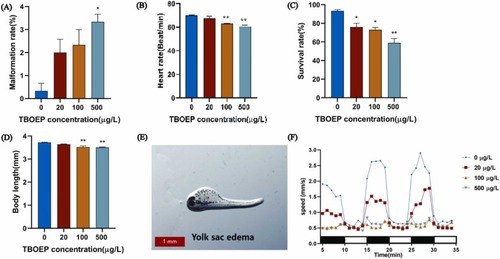
Malformation rate (A), heart rate (B), survival rate (C), body length (D), typical malformations (E) and locomotor patterns triggered by varying light shifts (F) in zebrafish larvae. The findings are displayed as mean ± SEM. (n = 30). The difference between the test and control groups is denoted by *p < 0.05 and * *p < 0.01. |
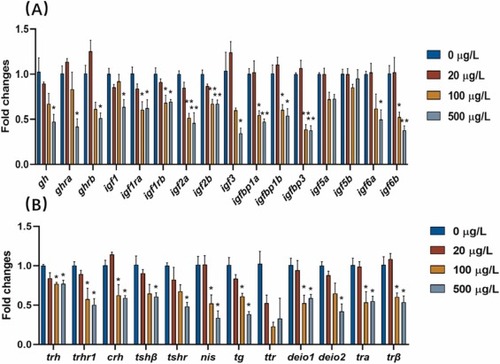
Analyzing gene expression patterns in chosen endocrine routes along the GH/IGF axis (A) and HPT axis (B) of progeny zebrafish. The findings are displayed as mean ± SEM. (n = 3). The difference between the test and control groups is denoted by *p < 0.05 and * *p < 0.01. |