
Image
|
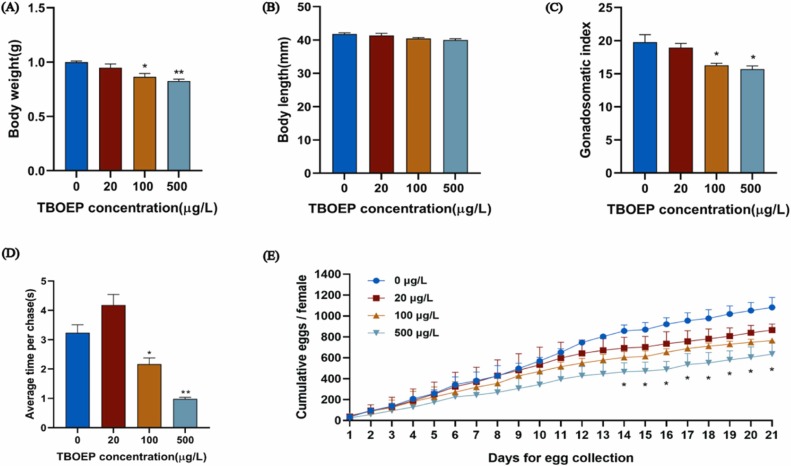
Figure Caption
Fig. 1 Impact on body weight (A), body length (B), gonadosomatic index (GSI) (C) (n = 30), the mean duration of interaction between fish of two sexes in 10 minutes (D) (n = 9) and cumulative eggs (E) (n = 30). The findings are displayed as mean ± SEM. *p < 0.05 and * *p < 0.01 signify notable disparities between the test and control groups.
Acknowledgments
This image is the copyrighted work of the attributed author or publisher, and
ZFIN has permission only to display this image to its users.
Additional permissions should be obtained from the applicable author or publisher of the image.
Full text @ Ecotoxicol. Environ. Saf.